Figure 7.
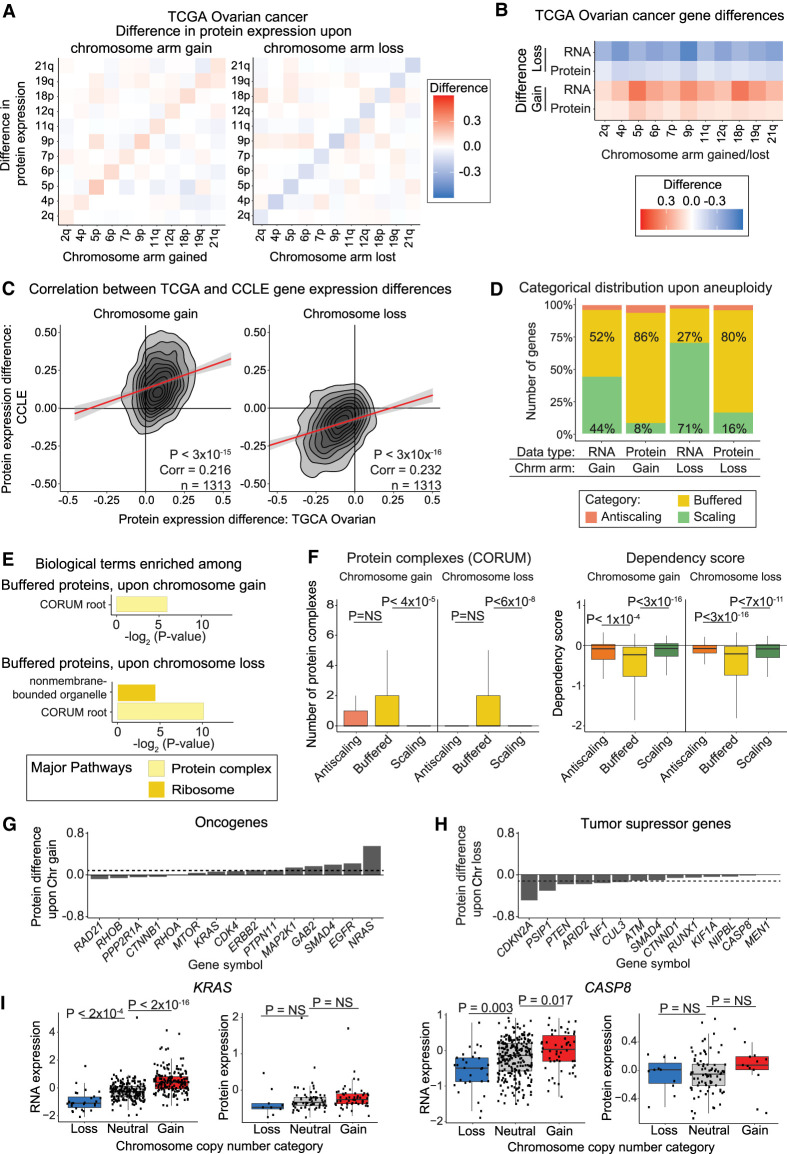
Dosage compensation in aneuploid ovarian tumors. (A) Heatmaps displaying the difference in protein expression between ovarian tumors with a chromosome arm gain (left) or chromosome arm loss (right) compared to tumors with neutral ploidy for that arm. The mean protein expression differences per chromosome arm are displayed. (B) Heatmaps displaying the same analysis as in A, but only for each aneuploid chromosome. (C) Density plots comparing the difference in CCLE and ovarian tumor protein expression differences upon the gain (left) or loss (right) of the chromosome arm on which the gene is located. Pearson correlation coefficient and P-value are displayed. Linear regressions (red) with 95% confidence intervals are displayed. (D) The percentage of ovarian tumor RNAs and proteins that fall into each difference category upon chromosome gain and loss are displayed. (E) Bar graphs displaying the biological terms enriched in ovarian tumor proteins buffered upon chromosome gain or loss, categorized by the major overarching pathway. (F) Boxplots displaying buffering factor scores, per difference category upon chromosome gain or loss using ovarian tumor data. Two buffering factors are displayed: number of protein complexes and dependency scores. P-values are from two-sided t-tests. Boxplots display the 25th, 50th, and 75th percentiles of the data, and the whiskers indicate 1.5 interquartile ranges. (G,H) Bar graphs displaying the mean protein expression difference for OGs upon chromosome gain (G) and TSGs upon chromosome loss (H), based on ovarian tumor data. Not all OGs and TSGs are displayed. Dotted lines indicate the mean differences in expression for all genes. Complete lists of OG and TSG expression differences upon chromosome gain and loss are available in Supplemental Table S2. (I) Boxplots displaying protein expression for KRAS and CASP8 by their chromosome copy number category. P-values in the boxplots were calculated from two-sided t-tests.

