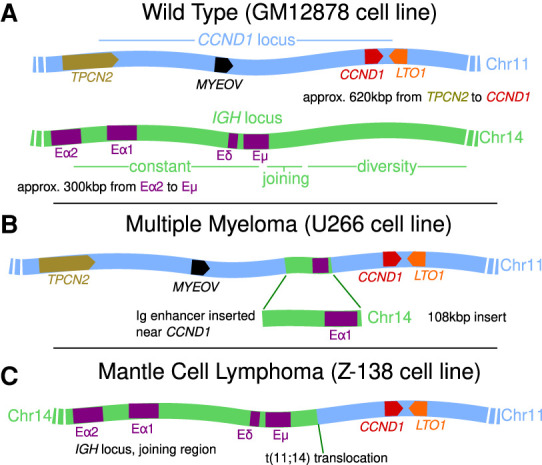
Figure 1.

Cartoons showing the layouts of the CCND1 and IGH loci. (A) Healthy cells. For CCND1, we show the approximate positions and orientations of four genes within the locus (TPCN2 lies just outside of the TAD which encloses the other three). For IGH, we show four previously identified enhancer elements within the constant region. (B) A rearrangement which has been observed in multiple myeloma (and in the U266 cell line) where an IGH insert bringing an enhancer element into the vicinity of CCND1 is shown. (C) A t(11;14) translocation often found in mantle cell lymphoma (and in the Z-138 cell line) which brings CCND1 next to the entire IGH constant region is shown.
