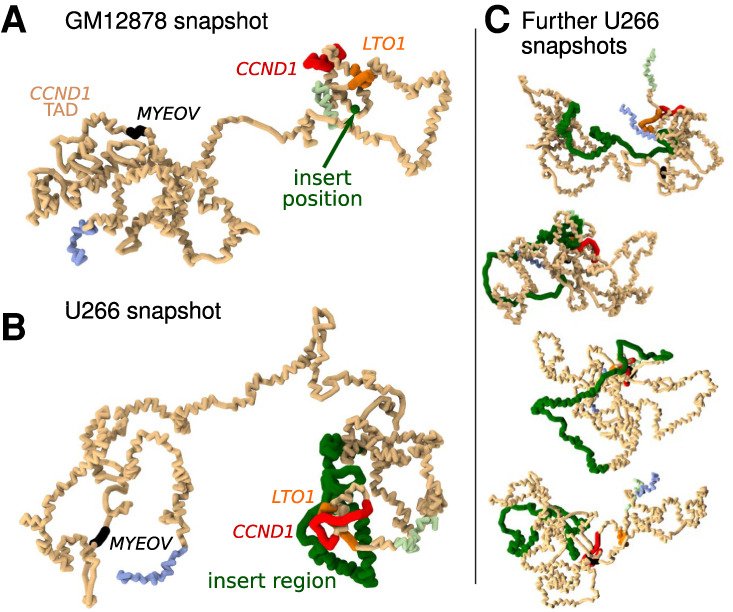
Figure 3.

Simulation snapshots. (A) Example snapshot from simulations showing the CCND1-TAD in GM12878 cells (pale orange region). Positions of genes are shown in different colors as labeled. Pale green and pale blue regions are within the neighboring TADs. (B) Similar snapshot from U266 simulations. The IGH insert containing Eα1 is shown in green; for comparison, in the snapshot in A, the position of the insert is shown as a single green bead. (C) Four further example snapshots for the U266 cells are shown.
