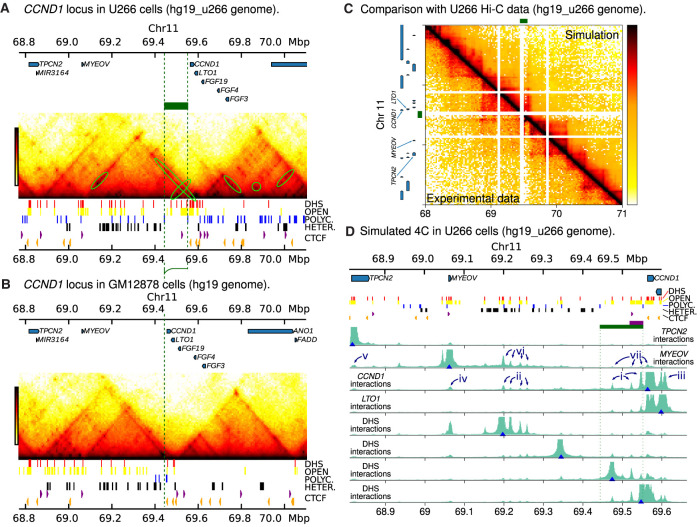
Figure 4.
Simulations of the CCND1 region in U266 cells. (A) Simulated Hi-C data is shown below a map of the genes within the rearranged CCND1 locus as found in the U266 cell line (hg19_u266 genome; a region encompassing the CCND1 and FGF19-TADs is shown). Green rings highlight additional interactions not present in GM12878 cells. The green block and dashed lines show the position of the inserted region. Data used as simulation input (obtained from BLUEPRINT and ENCODE) are shown as colored blocks under the Hi-C map using the same scheme as in Figure 2C. (B) Simulated Hi-C data are shown for the intact CCND1 locus for GM12878 cells (hg19 genome). The green dashed line indicates the insertion point for the U266 rearrangement. (C) Side-by-side comparison of simulation and Hi-C data for U266 cells obtained from Wu et al. (2017). Experimental data have been aligned to the in silico rearranged reference genome hg19_u266 (see Supplemental Methods Section 4 for details). Some unmappable regions are visible as gaps in the data (white stripes); for ease of comparison, the same regions are masked in the simulation map. The lower read depth of the data necessitates a lower map resolution (20-kbp bins compared to 10-kbp bins for GM12878 data). The green blocks to the top and left of the map show the position of the insert region; gene positions are shown to the left. See Supplemental Figure S4 for a comparison of called TAD boundaries. (D) Simulated 4C plots are shown for U266 at various viewpoints (blue triangles). In the top four tracks, viewpoints are at promoters of TPCN2, MYEOV, CCND1, and LTO1. The bottom four tracks show reciprocal viewpoints from interacting regions. The green block and dashed lines show the position of the insert, red blocks show DHSs, and the purple block shows Eα1. Some features are labeled with numbered arrows as detailed in the text.

