Figure 2.
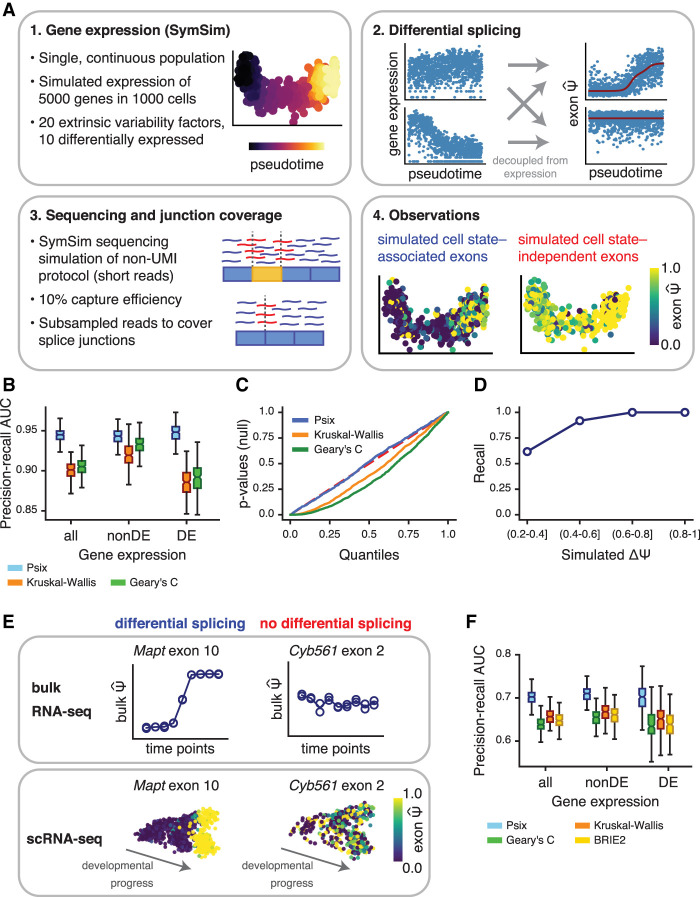
Psix identifies cell state–associated splicing in simulated and real data. (A) Pipeline for simulation of single-cell splicing. Variance in the observations can come from a change in splicing across the cell state (positives) or from other sources, for example, technical noise, or true variance that is not associated with the primary axes of variation in cell state (here, determined by the simulated trajectory; negatives). (B) Area under the precision-recall curve showing success of Psix and other methods at identifying exons simulated to have a |ΔΨ| ≥ 0.2 across a single lineage. Performance was assessed separately on exons in genes simulated as differentially expressed (DE) and not differentially expressed (nonDE). (C) P-value distributions of the negative exons when tested with Psix, Kruskal–Wallis, and Geary's C. The P-values of Psix do not deviate significantly from the uniform distribution. (D) Recall of exons simulated with different magnitudes of ΔΨ. (E) Validation strategy for cell state–associated splicing in single cells based on comparable bulk RNA-seq data. (F) Area under the precision-recall curve representing the overlap of cell state–associated exons in scRNA-seq data and differentially spliced exons in bulk RNA-seq data, both from midbrain neurons. We compared performance on exons in differentially expressed genes (DE) and non-differentially expressed genes (nonDE).

