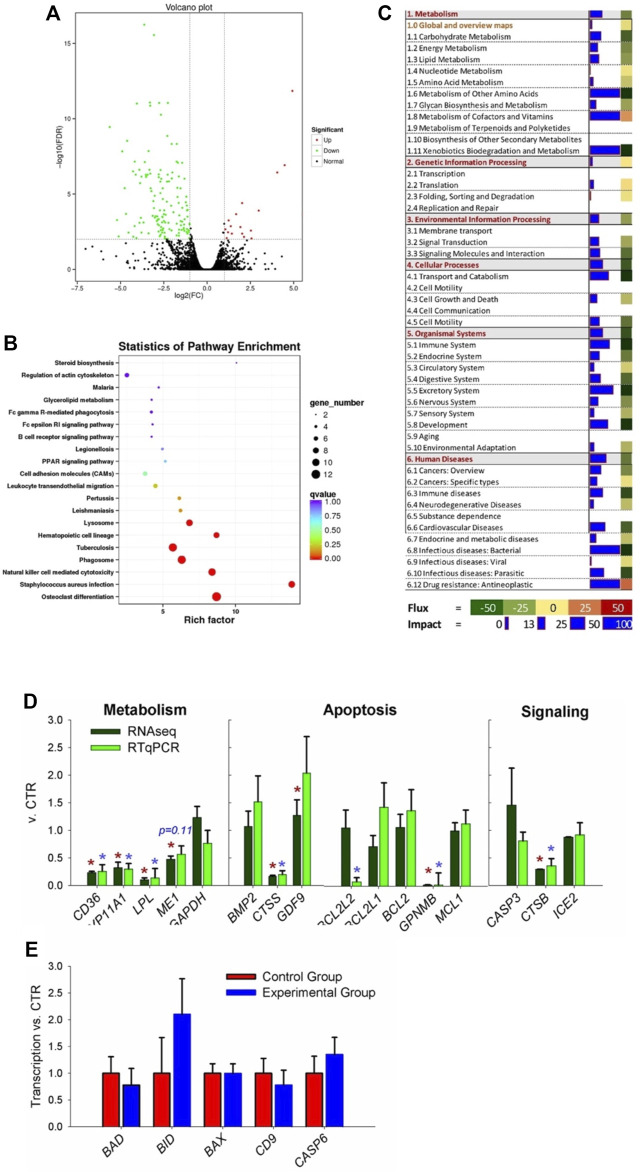
FIGURE 3.
Transcriptomic analysis of ovary tissues in rabbit where coprophagy was prevented (i.e., experimental group) and a control group (n = 3 per group). (A) Volcano plot of differentially expressed genes (expression ratio experimental/control group). (B) KEGG pathways enriched (p < 0.05) in DEGs by using KOBAS. (C) Summary of main categories of KEGG pathways generated by using the Dynamic Impact Approach. Blue horizontal bars denote impact (larger the bar, larger the impact) and squares besides the blue horizontal bars denote flux of the pathway that can be induced or inhibited as indicated in the bottom legend. (D) RNA-seq vs. RT-qPCR for transcripts selected among the ones related to metabolism, apoptosis, and signaling pathways. (E) Additional transcripts measured by RT-qPCR involved in apoptosis and related to cathepsin B activity.

