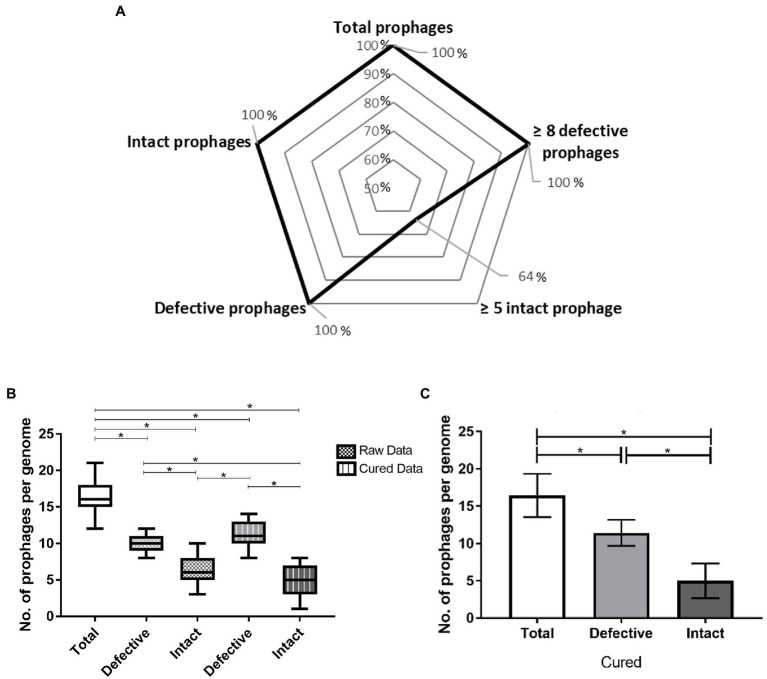
Figure 1.
Prophage prevalence in Paenibacillus larvae genomes: (A) Percentage of hosts with ≥ one and ≥ five intact prophages and ≥ one and ≥ eight defective prophages. (B) Whisker plots of prophage frequency per bacterial genome (total, defective and intact) before and after manual curing. Raw data provided directly from PHASTER, cured data results from manual verification. The horizontal line of each box represents the average prophages per genome and the external edges to the minimum/maximum number. (C) Average of total, defective, and intact prophages present per host genome. The error bars indicate the SD. Statistically significant, if value of p < 0.05 (*).

