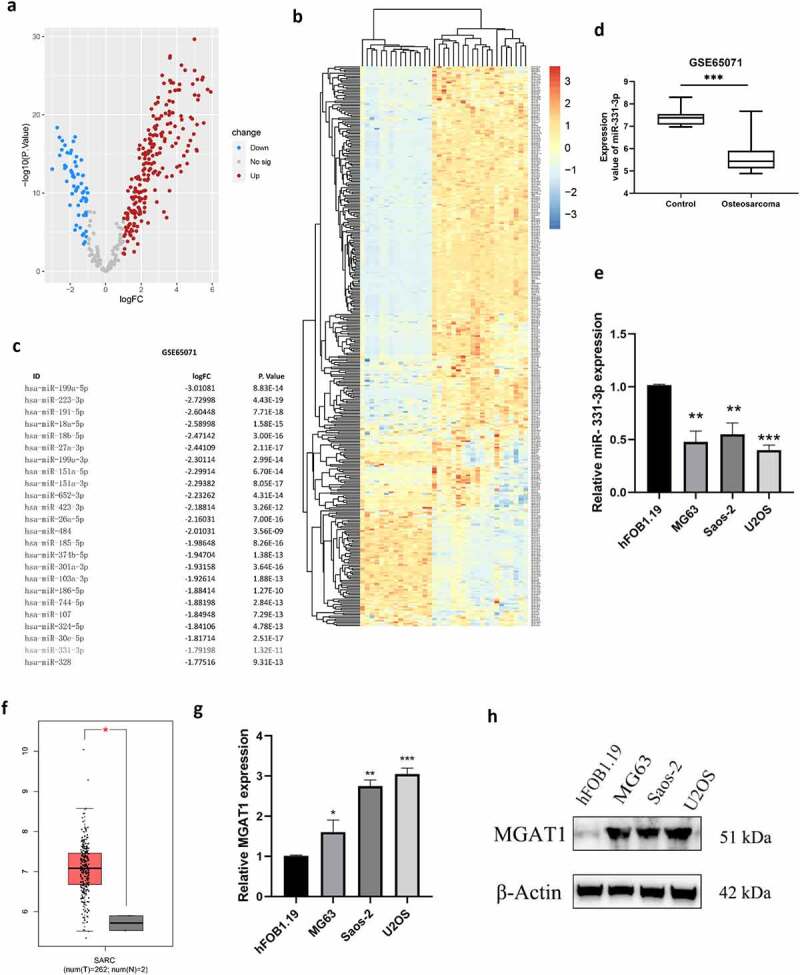
Figure 1.

OS tissues and cell lines exhibited low-expressed miR-331-3p but highly expressed MGAT1. (a) Differentially expressed miRNAs between OS and normal tissues were analyzed using volcano plots. (b) Upregulated and downregulated miRNAs from the GSE65071 dataset were compared using a clustered heat map. (c) Top 25 down-regulated miRNAs. (d) Using the GSE65071 dataset, the expression levels of miR-331-3p were determined in OS tissues. (e) Utilization of RT-qPCR to quantify miR-331-3p in OS cell lines, respectively. (f) OS tissues (n = 262) and non-tumor tissues (n = 2) MGAT1 mRNA expression levels were determined using GEPIA bioinformatics analysis. (g) MGAT1 mRNA expression levels were determined in hFOB1.19, MG-63, Saos-2, and U2OS cells using RT-qPCR. (h) WB was utilized to determine MGAT1 protein expression in hFOB1.19, MG63, Saos-2 and U2OS cells. *P < 0.05, **P < 0.01 and ***P < 0.001.
