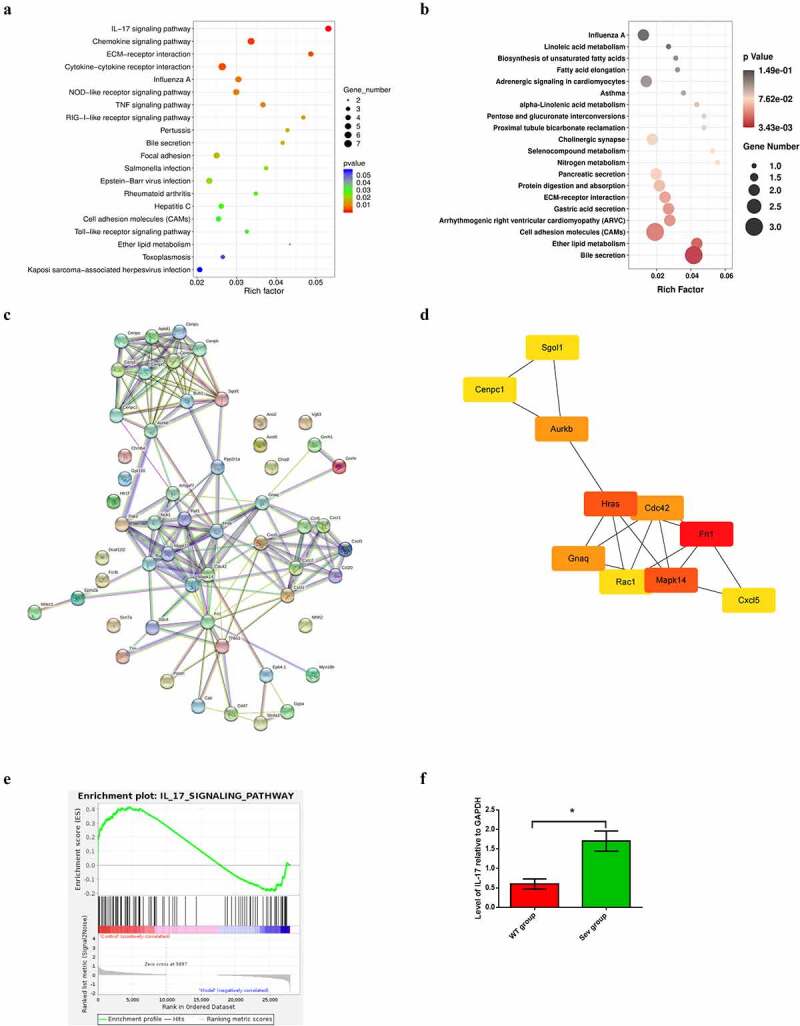
Figure 3.

KEGG pathway analysis of DEGs, PPI network construction and hub gene identification (a) KEGG pathway enrichment scatter diagram in WT and WT + sevoflurane group. (b) KEGG pathway enrichment scatter diagram in IL-17A−/− and IL-17A−/− + Sev group. (c) The protein–protein interaction network of DEGs in WT and WT + sevoflurane group. (d)Ten hub genes with the highest degree in WT and WT + sevoflurane group(Red square indicates a higher degree, and yellow square indicates a lower degree). (e) GSEA gene enrichment analysis diagram. (f) Differential expression of IL-17 was confirmed by RT-PCR. Data are expressed as mean ± SD. Compared with WT group, *P < 0.05.
