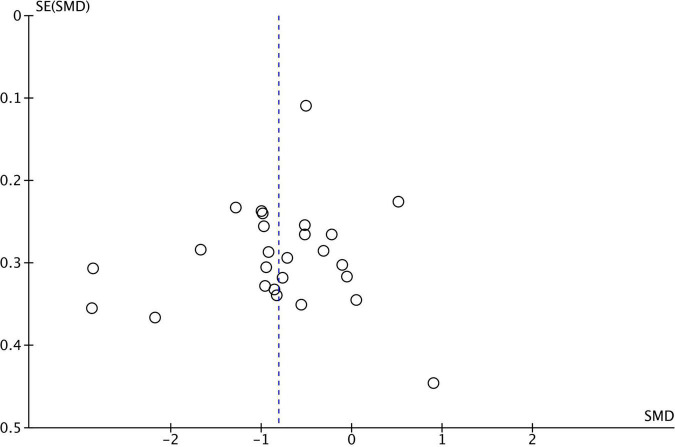
FIGURE 3.
Funnel plot–theory of mind funnel plot for 26 studies comparing theory of mind performance between ASD and TD. SMD, standard mean difference (effect size); SE, standard error. Positive effect sizes indicate superior performance in ASD. The solid vertical line indicates the estimate for the population effect size.

