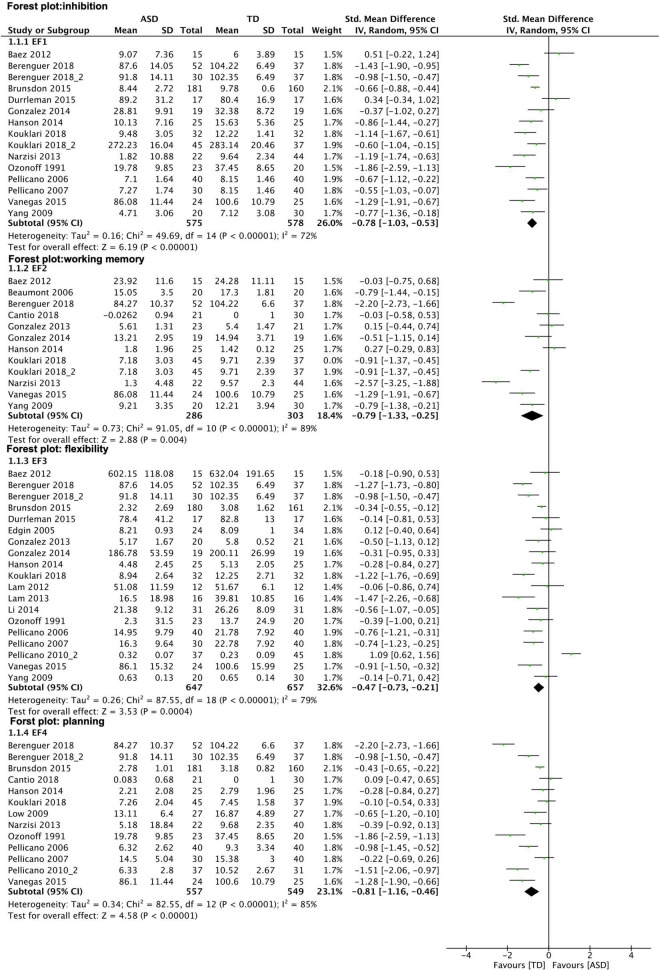
FIGURE 5.
Forest plot–executive function: subgroup analysis of EF domains. Results show medium effect size measures for all EF subtypes observed. Graphical explanations: horizontal lines present 95% confidence Interval of the effect sizes for each study; green dot: hedges‘g; diamond shape: overall effect size.

