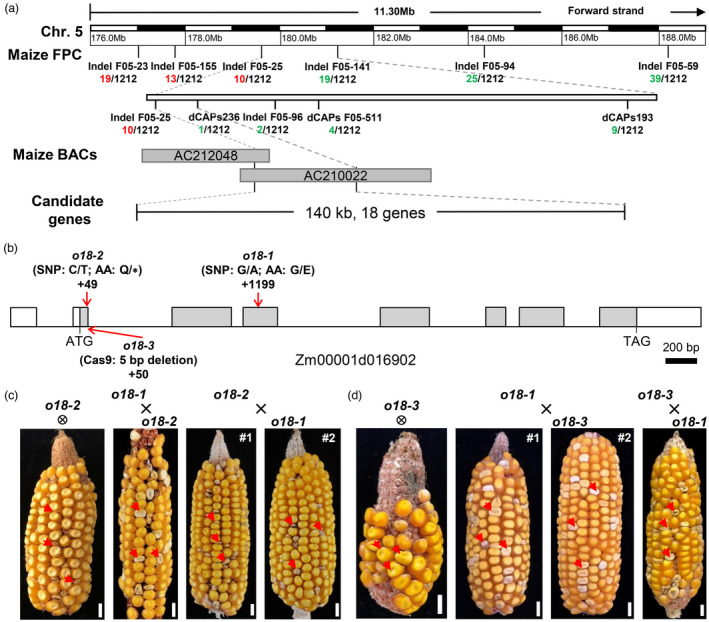
Figure 3.

Map‐based cloning and genetic confirmation of O18. (a) The o18 locus was mapped to a 140‐kb region on chromosome 5. The number under each molecular marker indicates recombinants found in the population. BAC means bacterial artificial chromosome, which represents the physical interval of o18. (b) Schematic diagram of the O18 gene with indicated mutation sites. Lines represent introns, grey boxes represent coding region, and white boxes represent the 5′ and 3′ untranslated regions. (c) An allelism test between o18‐1 and o18‐2. Self‐pollinated ear of heterozygous o18‐2 and the reciprocally crossed ears between heterozygous o18‐1 and o18‐2 segregate defective kernels (red arrow) at a ratio of ~25%. Bar is 1 cm. (d) An allelism test between o18‐1 and o18‐3. Self‐pollinated ear of heterozygous o18‐3 and the reciprocally crossed ears between heterozygous o18‐1 and o18‐3 segregate defective kernels (red arrow) at a ratio of ~25%. Bar is 1 cm.
