Figure 5.

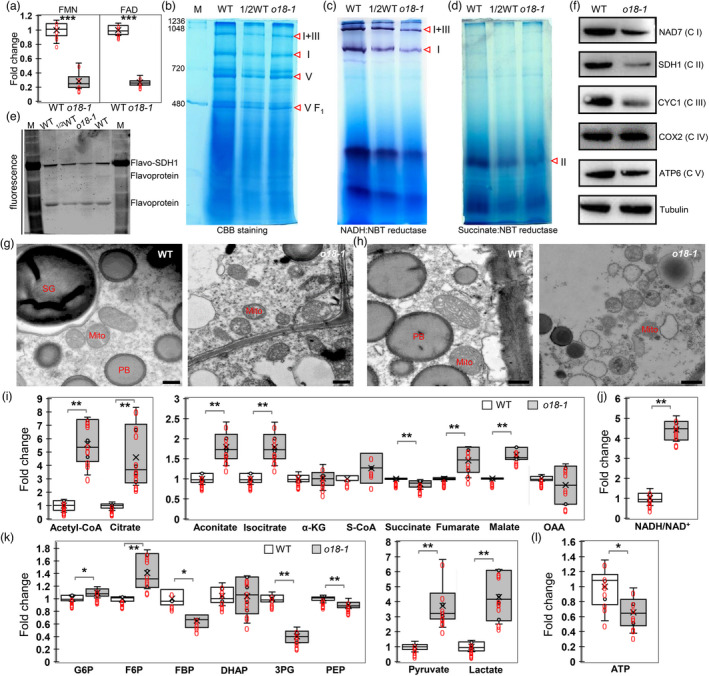
O18 affects the assembly and stability of complex I and complex II, and cellular energetics. (a) FMN and FAD content determination in o18‐1 and the wild‐type (WT) endosperm at 18 days after pollination (DAP) using HILIC LC‐MS/MS analysis. For each sample, three independent biological replicates were performed. Data are means with SE (***, P < 0.001, two‐tailed t‐test). (b) Blue native (BN) PAGE analysis of mitochondrial complexes in o18‐1. Mitochondria from endosperm of maize developing seeds at 15 days after pollination (DAP) were loaded onto a 5% to 13.5% gradient gel, and detected by using Coomassie Brilliant Blue (CBB) staining. Red triangles indicate the corresponding mitochondrial complexes. (c) NADH dehydrogenase activity detection of complex I in o18‐1. (d) Succinate dehydrogenase activity detection of complex II in o18‐1. (e) In‐gel fluorometry assay of WT and o18‐1 mitochondria for covalent FAD detection. Mitochondria were resolved by 10% SDS‐PAGE, incubated for 1 h in 10% acetic acid, and detected on an UV‐transilluminator system. (f) Immunodetection of the representative mitochondrial proteins. Proteins were extracted from developing seeds at 18 DAP without pericarp. NAD7, SDH1, CYC1, COX2 and ATP6 are subunits of complex I, II, III, IV and V respectively. Tubulin was used as the loading control. (g, h) Ultrastructure of mitochondria in WT and o18‐1 endosperm at 15 DAP (g) and 20 DAP (h). Bar is 500 nm. (i) Comparison of metabolites involved in tricarboxylic acid (TCA) cycle in WT and o18‐1. (j) NADH/NAD+ ratio in WT and o18‐1. (k) Comparison of metabolites involved in glycolysis in WT and o18‐1. (l) ATP levels in WT and o18‐1. For each sample, three independent biological replicates were performed. Data are means with SE (*P < 0.05, **P < 0.01, ***P < 0.001 by two‐tailed t‐test).
