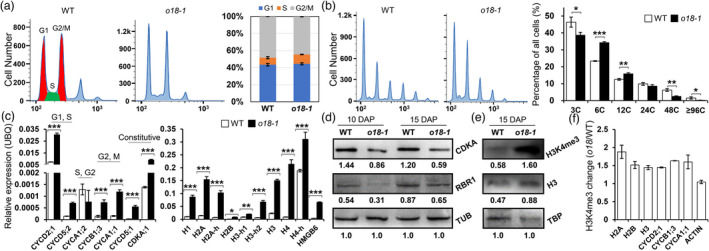
Figure 6.

O18 modulates endosperm mitotic and endoreduplicating cell‐cycle progression. (a) Flow cytometric assay of the mitotic cell cycle in endosperm of the wild type (WT) and o18‐1 at 7 days after pollination (DAP). Cell‐cycle phases were divided as previously reported (Manthey et al., 2006), in which 3C and 6C represent G1 and G2/M, while profile between them is S phase. Quantification was shown in the right panel. For each sample, three independent biological replicates were performed. (b) Flow cytometric assay of the endoreduplicating cell cycle in endosperm of the wild type (WT) and o18‐1 at 10 days after pollination (DAP). Quantification was shown in the right panel. For each sample, three independent biological replicates were performed. Data are means with SE (*P < 0.05, **P < 0.01, ***P < 0.001 by student t‐test). (c) Expression levels of cell cycle‐related genes in WT and o18‐1 kernels at 15 DAP. For each RNA sample, three technical replicates were performed. Representative results from three biological replicates are shown. Error bars represent SE (***P < 0.001 by student t‐test). Transcript abundance is indicated relative to the internal control Ubiquitin (UBQ). (d) Immunodetection of CDKA and RBR1 levels in WT and o18‐1 kernels at 10 and 15 DAP. Tubulin (TUB) was used as the loading control. Quantification was performed by using the band grey intensity, relative to TUB. Representative results from three biological replicates are shown. (e) Immunodetection of H3K4me3 levels in WT and o18‐1 kernels at 15 DAP. TATA‐binding protein (TBP) was used as the loading control. Quantification was performed by using the band grey intensity, relative to TBP. Representative results from three biological replicates are shown. (f) Relative H3K4me3 levels in representative genes in WT and o18‐1 kernels at 15 DAP. ChIP values were normalized to their respective DNA input values, and the fold changes were calculated based on the relative enrichment in anti‐H3 compared with anti‐ H3K4me3 immunoprecipitates. Representative results from three biological replicates are shown.
