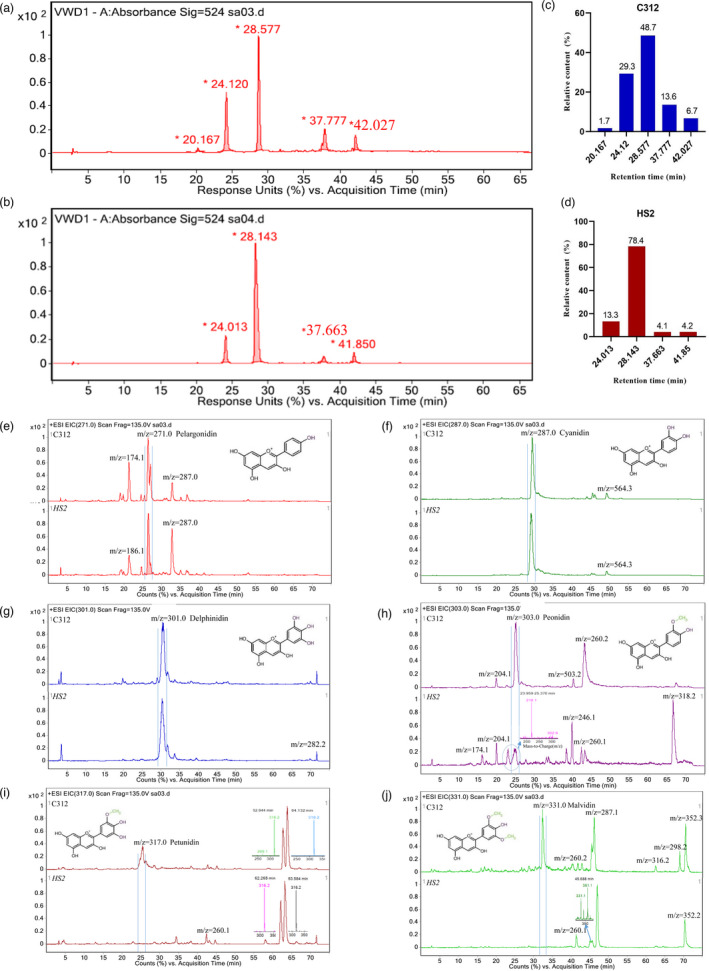
Figure 2.

Analysis of anthocyanidin gradients in C312 and HS2. (a, b) HPLC‐LC/MS chromatograms of anthocyanins in C312 (a) and HS2 (b); c, d. Statistics of the relative proportion of different anthocyanin components in C312 (c) and HS2 (d) respectively. (e–j) Six main anthocyanidins profiles in cotton leaves determined by LC/MS ESI positive ion scanning in C312 and HS2. (e) Pelargonidin ([M + H]+ = 271); (f) Cyanidin ([M + H]+ = 287); (g) Delphinidin ([M + H]+ = 301); (h) Peonidin ([M + H]+ = 303); (i) Petunidin ([M + H]+ = 317); (j) Malvidin ([M + H]+ = 331). Peaks marked with vertical lines indicate the specific anthocyanidin monomer in each picture.
