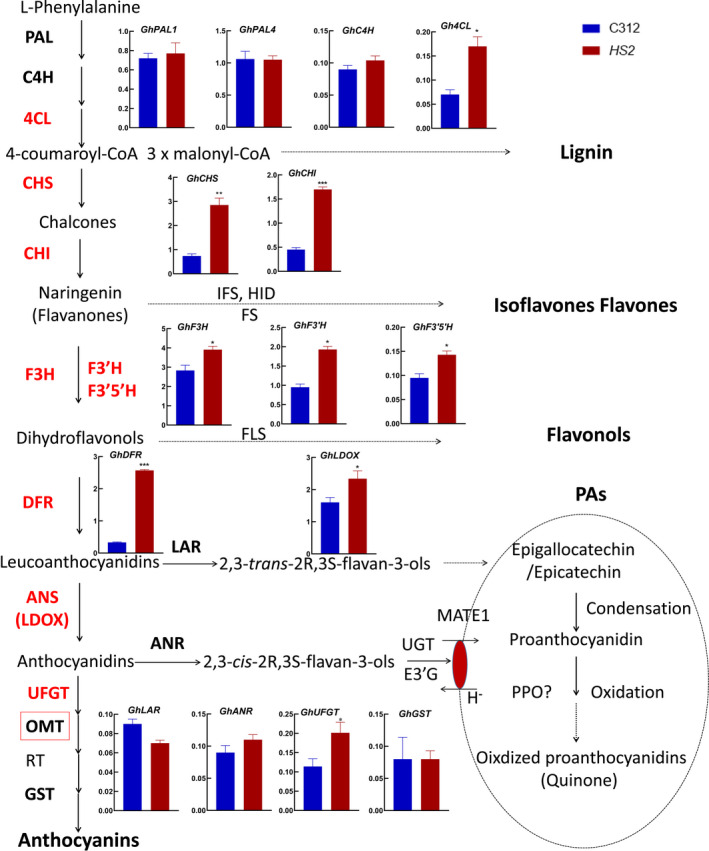
Figure 4.

Expression analysis of genes involved in phenylpropanoid pathway, anthocyanins pathway and PA pathway in C312 and HS2. Main products and enzymes in phenylpropanoid pathway, anthocyanins pathway and PA pathway are shown in diagram. Genes that encode enzymes in bold were analysed by qRT‐PCR and the relative expression levels in C312 and HS2 were listed nearby. The relative genes of enzymes in red were significantly up‐regulated in HS2 while that in black did not show apparent changes. Significance analysis was performed by Student’s t‐test between C312 and HS2 (mean ± sd; n = 5; *P < 0.05, **P < 0.01).
