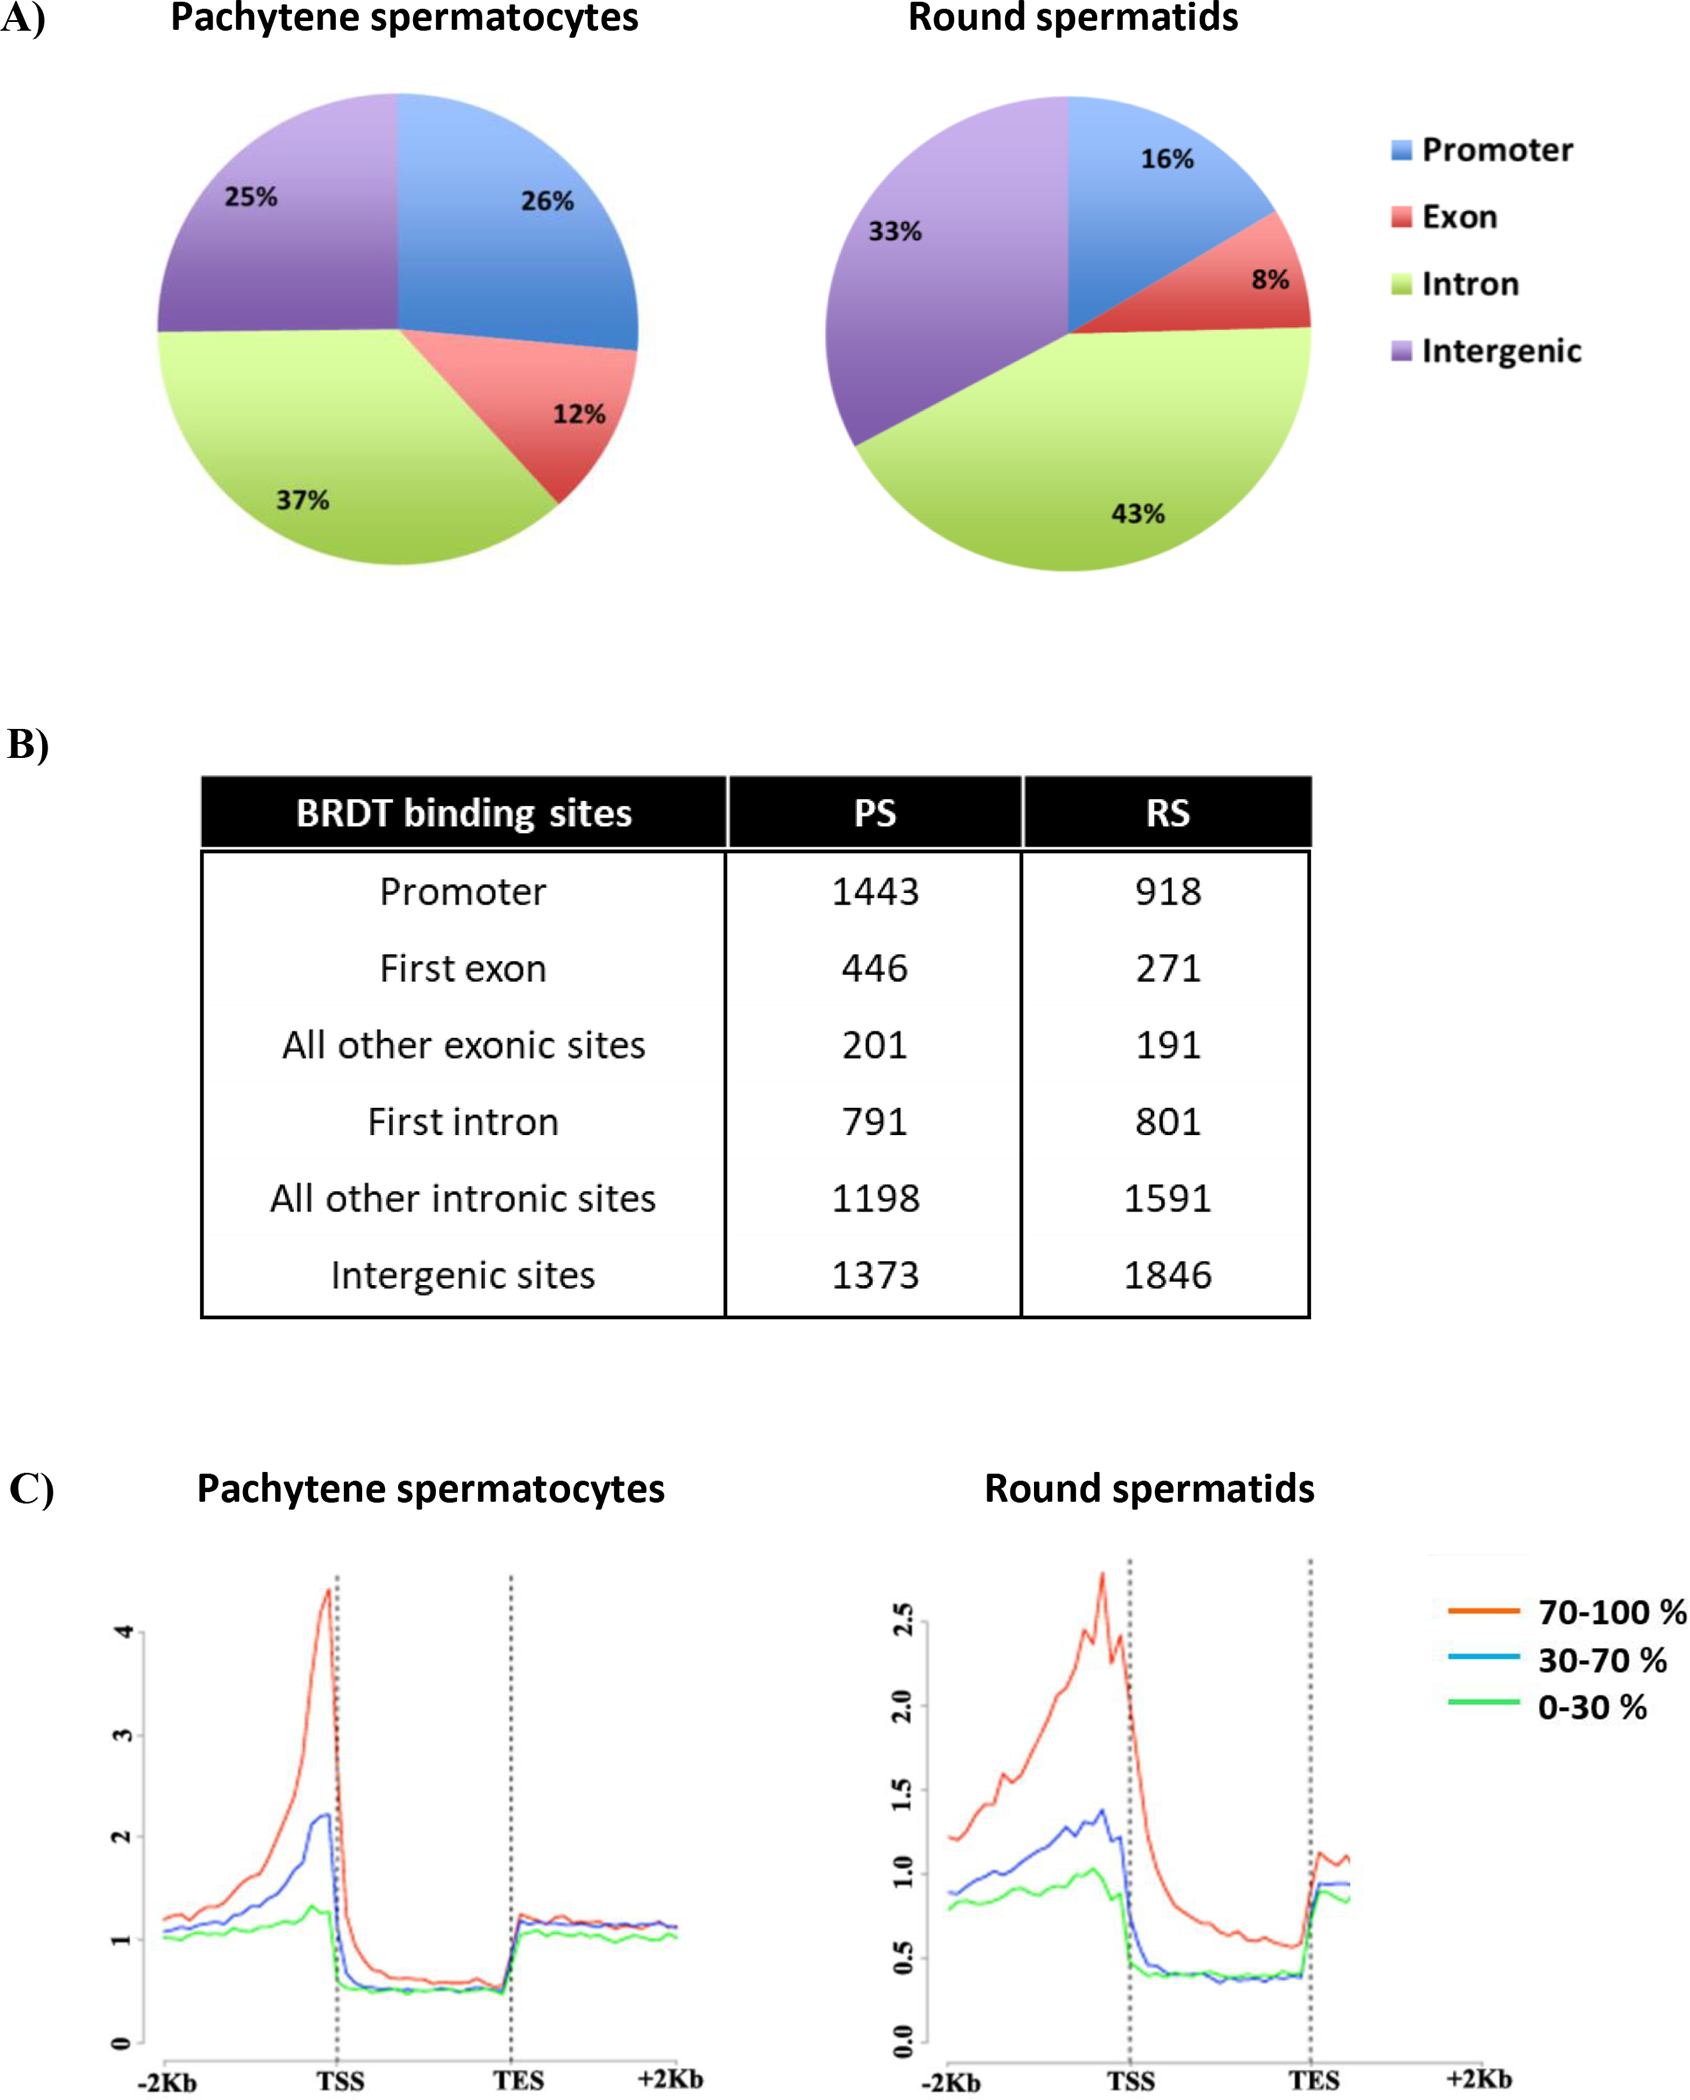
Figure 1.

High–resolution genome-wide analysis of BRDT-containing complexes occupancy in pachytene spermatocytes (PS) and round spermatids (RS) of wild type mice. (A-B) Pie chart shows genomic annotation of location and number of BRDT binding sites across the genome in wild type PS and RS. (C) High-resolution analysis of average tag density across a gene body in wild type mouse testicular cells. In each plot, genes were classified into 3 groups based on expression levels in PS and RS: highly expressed (the top 30% of genes indexed by expression levels, red lines), medium expression (the middle 40% of genes, blue lines) and lowly expressed (the lowest 40% of genes, green lines). Average tag density across the gene unit was plotted for each group. TSS, Transcription Start Sites; TES, Transcription End Sites
