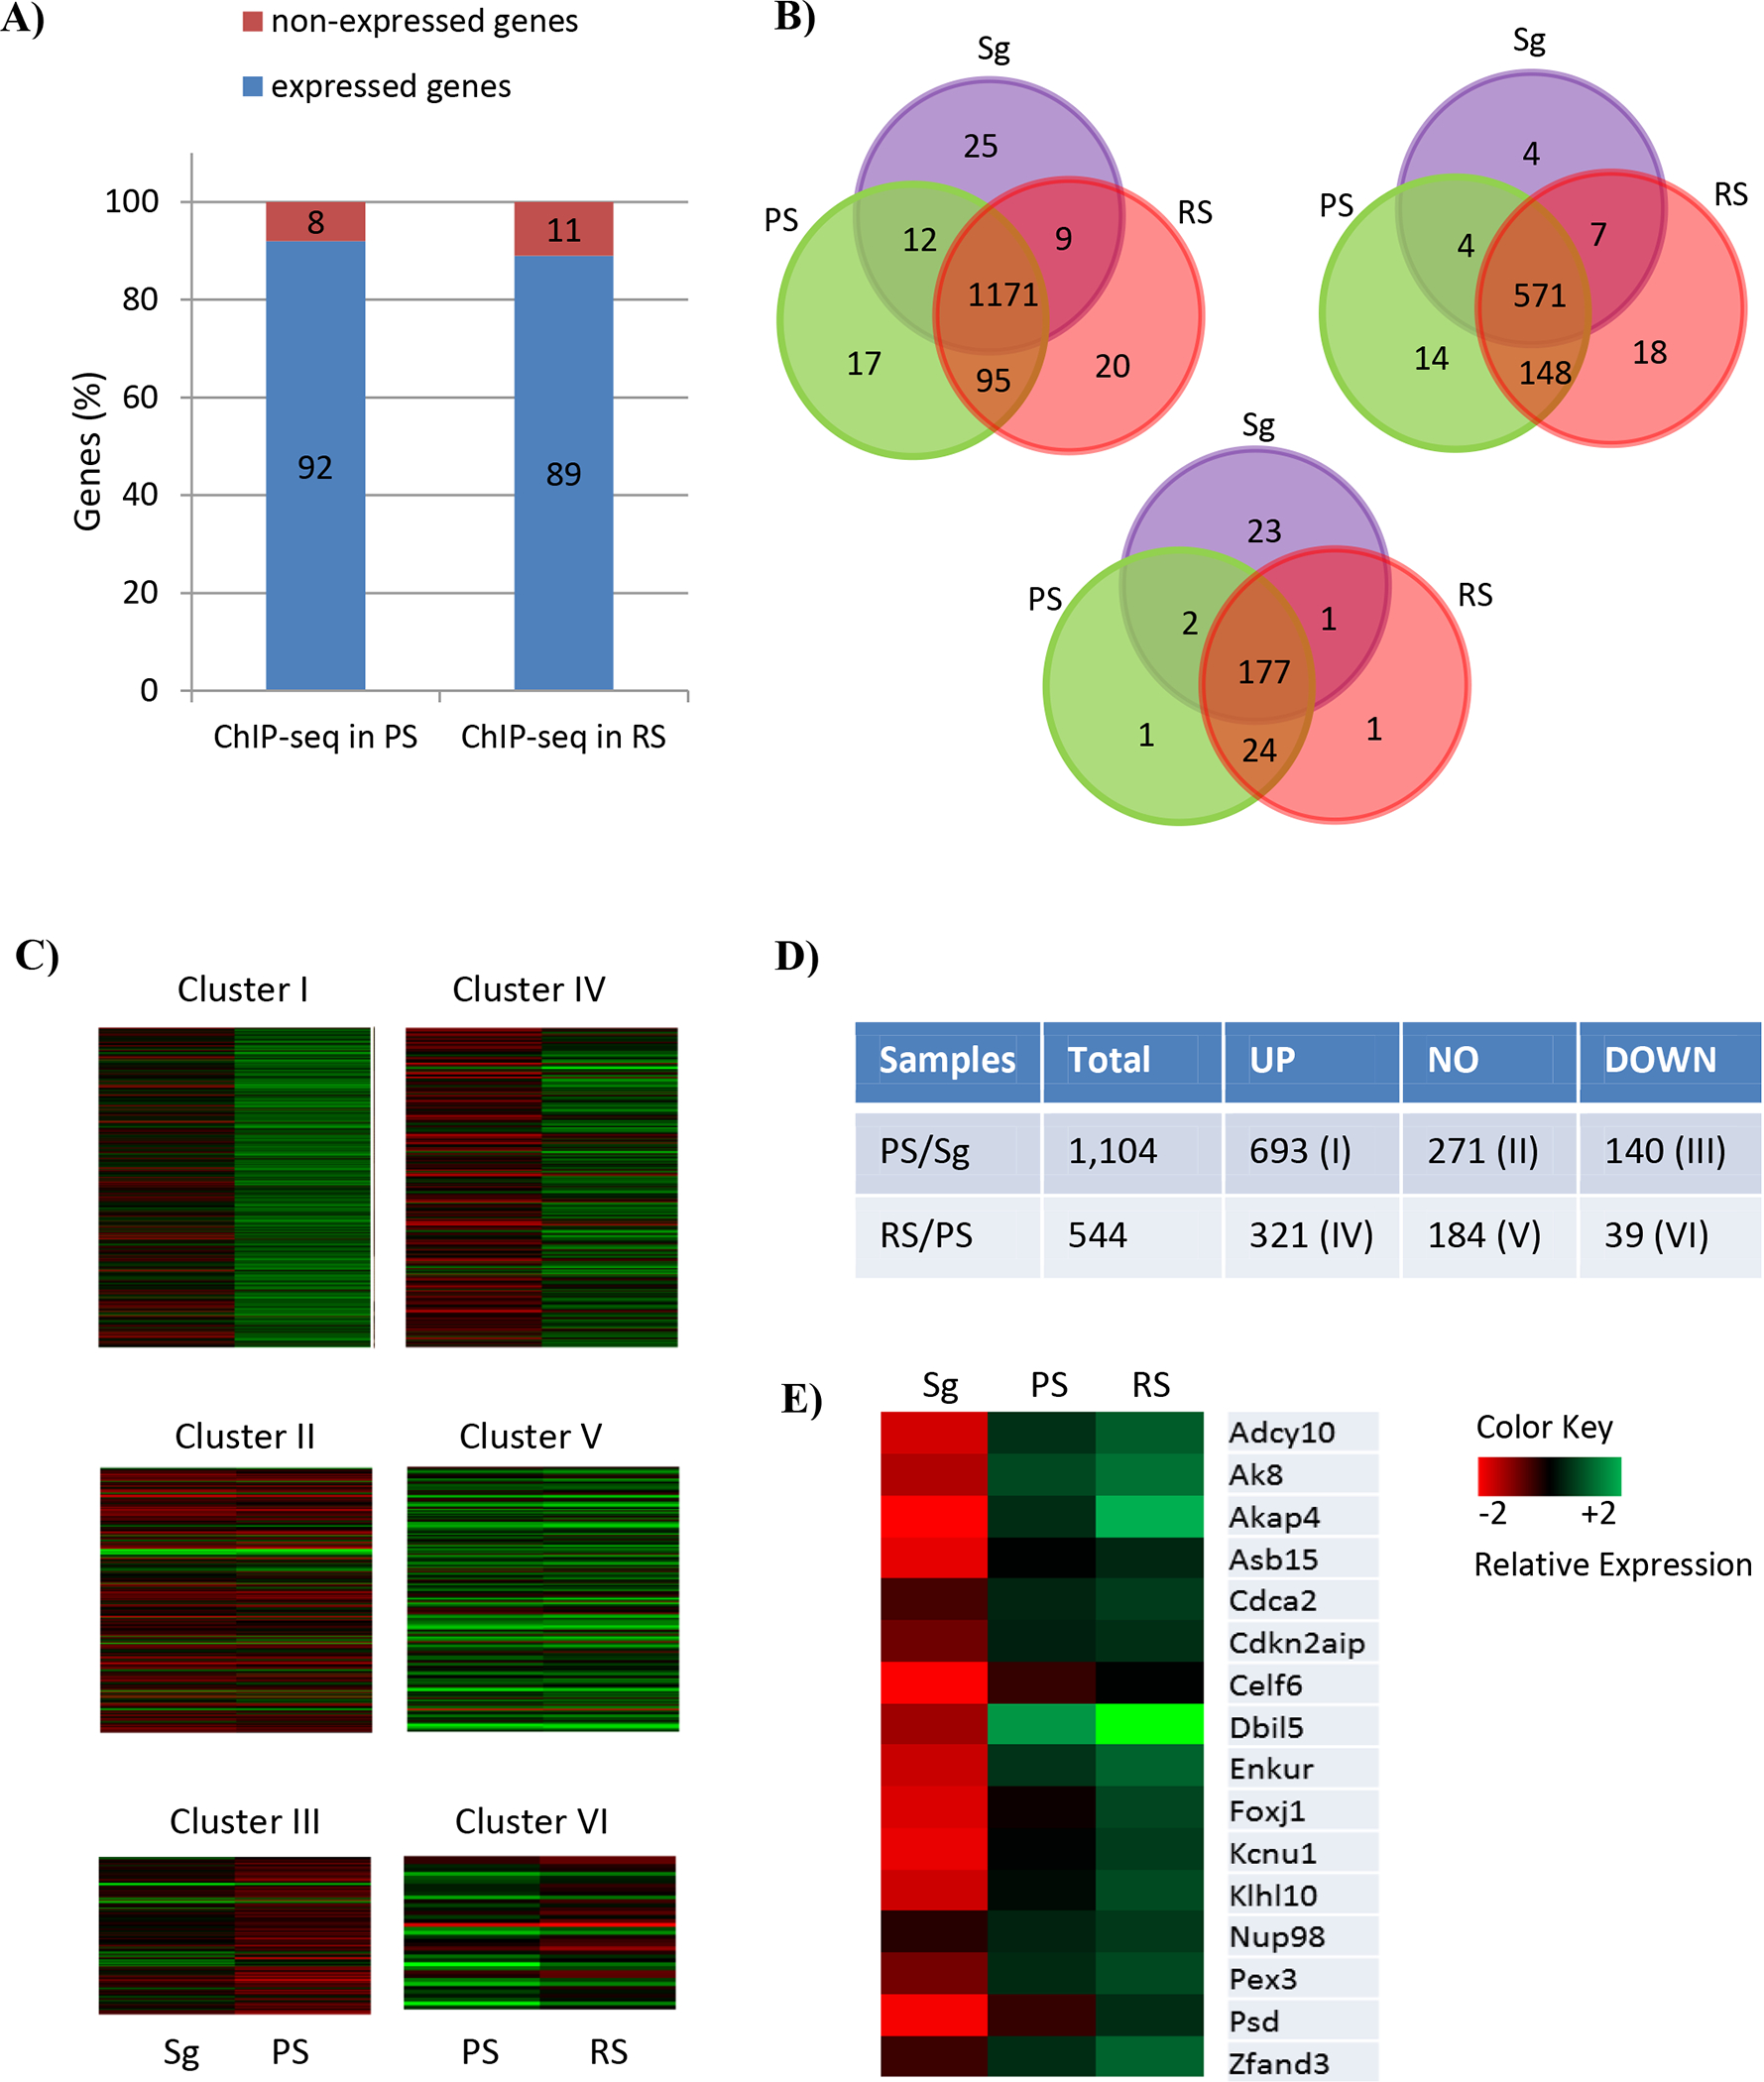
Figure 3.

Comparative BRDT ChIP-seq and transcriptome analysis corresponding to the staged mouse spermatogenic cells. (A) Respective proportions of BRDT-bound genes in PS and RS, which are expressed and non-expressed in PS and RS, respectively. A total of 1,444 and 888 BRDT-bound genes in PS and RS, respectively were included. (B) Venn diagram of the genes expressed in three cell types, Sg, PS and RS, within the BRDT-bound genes either in PS (left) or RS (right) and both PS and RS (bottom). Distinct and overlapping expression between and among the cell types is shown. Purple, green and red cycles represent Sg, PS, and RS, respectively. (C) Heat maps showing the expression of 6 clusters of BRDT-bound genes that are expressed in PS and RS. The following comparisons were performed: PS vs. Sg; RS vs. PS (Log2 Fold Change (|FC|) ≥ 2; p < 0.01). Columns indicate specific cell types and rows indicate genes. The low versus high expression levels are represented on a red to green scale. (D) Total number of up-, down-, and non-differentially regulated genes belonging to each of the Clusters (|FC| ≥ 2; p < 0.01 (E) Heat map showing relative expression levels of the 16 genes overlapping between Cluster I and Cluster IV. The low versus high expression levels are represented on a red to green scale.
