Figure 1.
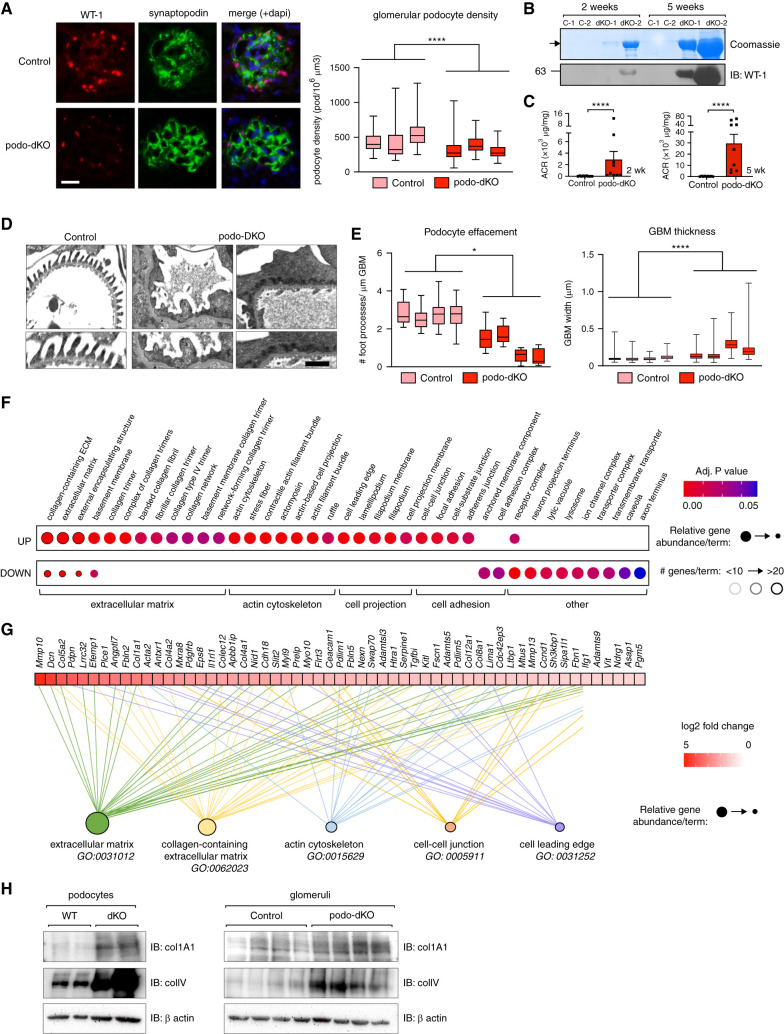
Loss of Nck induces aberrant expression of ECM, cell adhesion, and actin-binding genes within the podocyte. (A) Estimated podocyte density in control and podo-dKO mice at 6 weeks of age determined by analysis of kidney sections immunostained for podocyte markers WT-1 and synaptopodin. Box-and-whisker plots represent independent measurements within each animal. ****P<0.0001, *by Mann-Whitney two-tailed t test. (B) Progressive albuminuria and accompanying podocyte loss in podo-dKO mice compared with controls (C-1, C-2) was shown by Coomassie staining of SDS-PAGE urine gels for albumin and immunoblotting (IB) of urinary precipitates for WT-1. (C) Albuminuria was quantified by albumin-creatinine ratio (ACR) in neonatal (2–3 weeks) and young adult (5–6 weeks) mice. ****P<0.0001, by Mann-Whitney two-tailed t test. (D–E) Analysis of foot process effacement and GBM thickening in (D) transmission electron micrographs at 5 weeks of age; quantification in (E). Scale bar, 1 μm. Box-and-whisker plots represent independent measurements within each animal. *P<0.05 and ****P<0.0001, by Mann-Whitney two-tailed t test. (F) Dot plot of cellular component GO-enriched terms in gene lists generated from greater than log2 fold change transcriptional changes between WT and dKO podocytes, as identified by microarray. Relative abundance of the number of genes identified for each term in upregulated (UP) versus downregulated (DOWN) (relative to WT) is represented by circle size, total number of terms by border color, and adjusted P value by circle color. (G) Genes contributing to the top five cellular component GO-enriched terms were also displayed as heat maps on the basis of fold-change difference in dKO versus WT cells by magnitude. (H) Immunoblotting of collagen 1A1 and type IV collagen in WT and dKO podocytes and control and podo-dKO glomerular lysates. Adj., adjusted.

