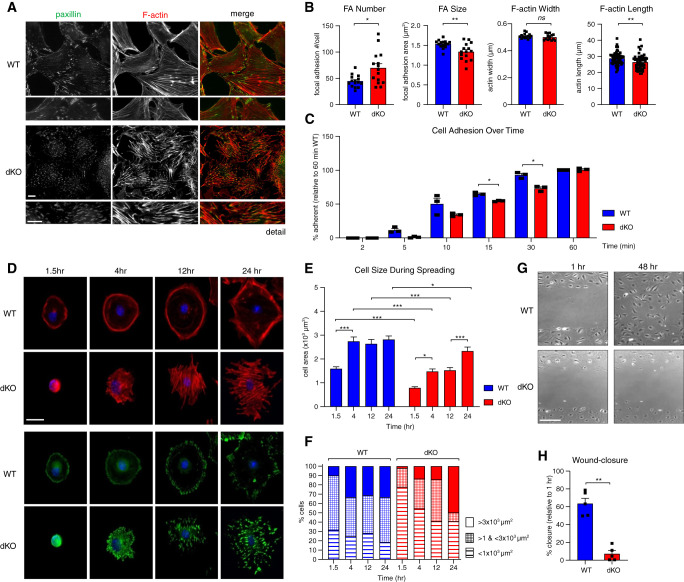
Figure 2.
Nck adaptors coordinate actin and focal adhesion turnover during dynamic cellular events. (A) Dual immunofluorescence staining of differentiated WT and Nck1 and Nck2 dKO podocytes for paxillin (focal adhesion marker) and F-actin. Scale bar, 100 μm. (B) Quantification of focal adhesion (FA) number and size and actin stress fiber width and length. *P<0.05, **P<0.01, Mann–Whitney two-tailed t test. (C) Quantification of podocyte adherence to type IV collagen–coated substrate post-trypsinization, over time. **P<0.01, two-way ANOVA and Tukey multiple comparisons test. (D) Immunofluorescence imaging and (E–F) quantification of cell size during spreading on type IV collagen–coated substrate post-trypsinization, over time. *P<0.05, **P<0.01, ***P<0.001, two-way ANOVA and Tukey multiple comparisons test. (G) Representative brightfield images and (H) quantification of differentiated WT and dKO podocytes during in vitro wound healing assay. **P<0.01, Mann–Whitney two-tailed t test.

