Figure 8.
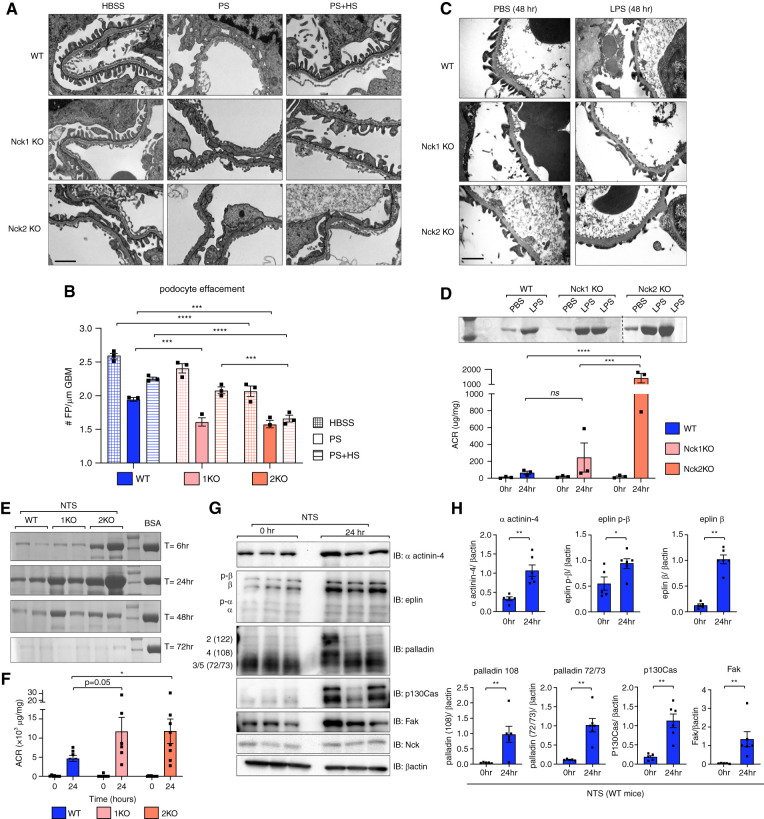
Nck1 and Nck2 KO animals show differential susceptibility to experimental disease models. (A) Transmission electron micrographs showing foot process morphology in WT, Nck1 KO, and Nck2 KO mice after perfusion with PS (injury), PS and HS (recovery), or vehicle alone (HBSS). Scale bar, 1 μm. (B) Quantification of foot process (FP) effacement from (A). ***P<0.001, ****P<0.0001, two-way ANOVA and Tukey multiple comparisons test. (C) Transmission electron micrographs of mice injected with LPS or vehicle alone (PBS) at the peak injury time point of 48-hours post-injection. (D) A Coomassie urine gel and urinary albumin-creatinine ratio (ACR) demonstrate heightened proteinuria in Nck2 KO mice after LPS-induced disease. ***P<0.001, ****P<0.0001, two-way ANOVA and Tukey multiple comparisons test. (E) Coomassie urine gel displaying albuminuria over the injury (6–24 hours) and recovery periods (48–72 hours) of NTS-induced disease (BSA serves as a positive control). (F) Urinary ACRs at the peak time point of 24 hours after NTS quantify differences between genotypes. *P<0.05, two-way ANOVA and Tukey multiple comparisons test. (G) Immunoblotting (IB) and (H) densitometric quantification of glomerular lysates from WT mice pre- and post-NTS injection. *P<0.05, **P<0.01, Mann–Whitney two-tailed t test. 1KO, Nck1 KO; 2KO, Nck2 KO.

