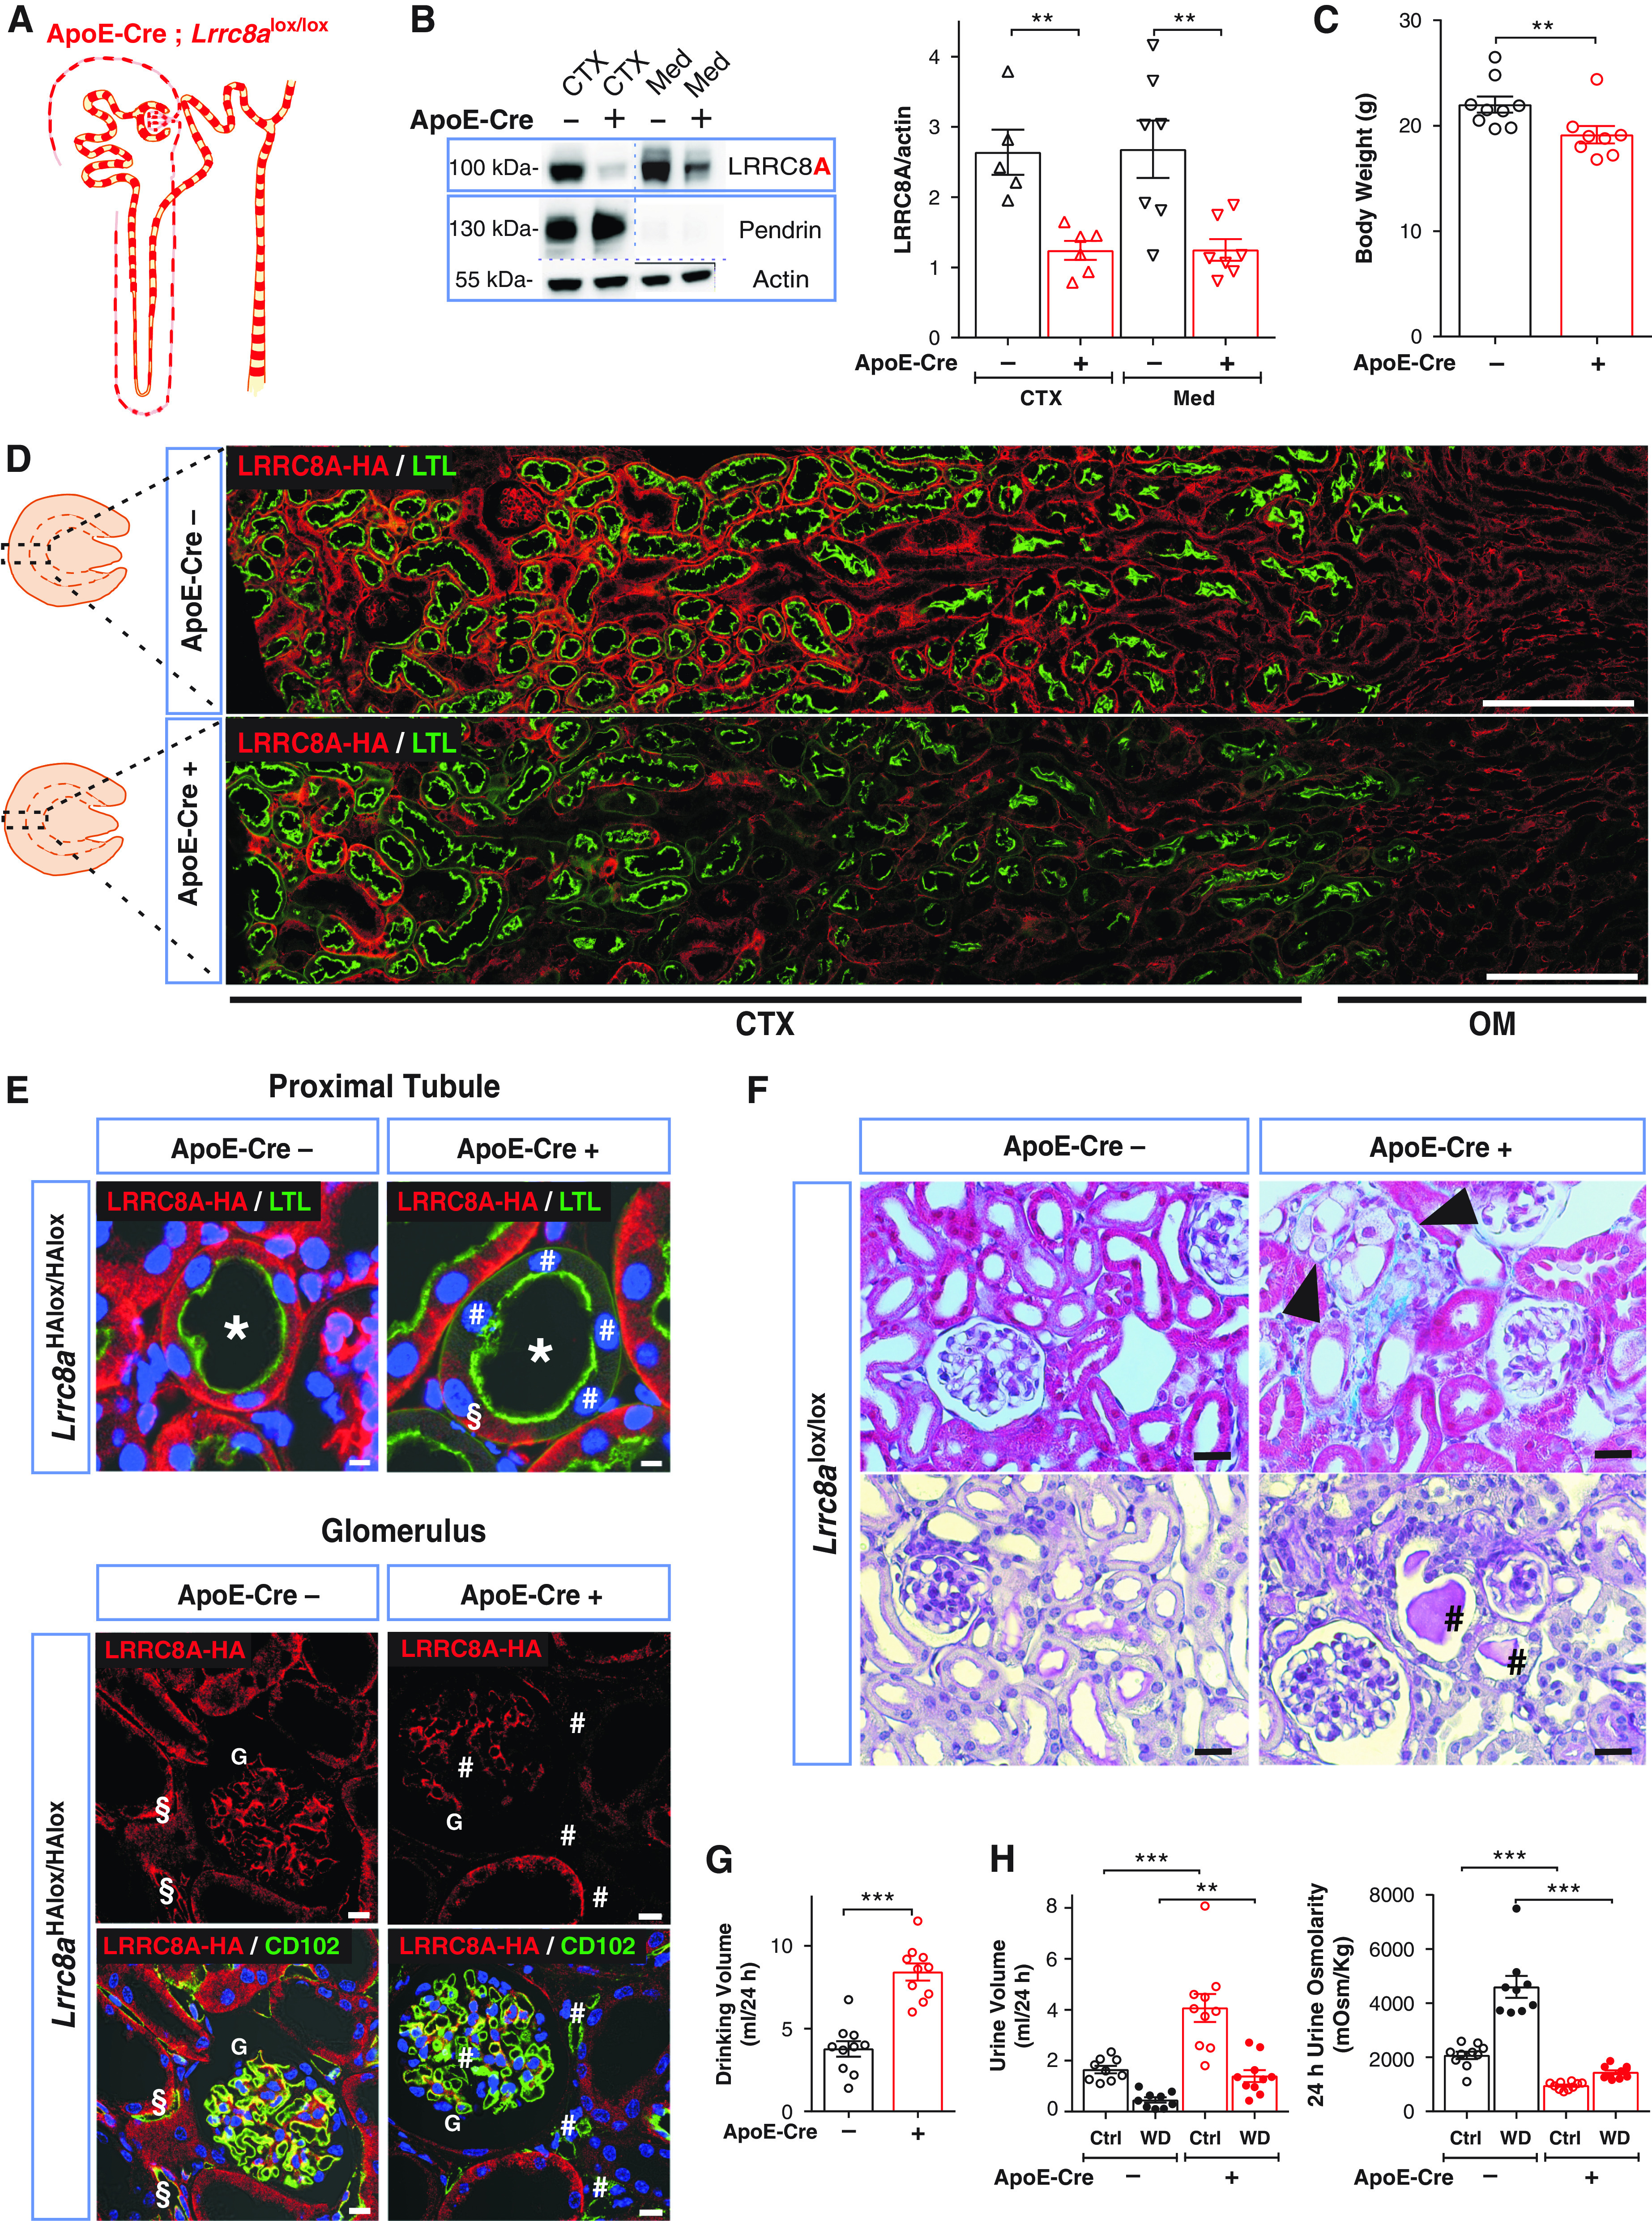
Figure 4.

Disruption of the essential VRAC subunit LRRC8A results in hypoosmolar polyuria in ApoE-Cre;Lrrc8alox/lox mice. (A) Sketch of chimeric Lrrc8a disruption both in nephron and blood vessels driven by ApoE-Cre. (B) Left, Western blot analysis of LRRC8A expression in kidney cortex (CTX) and medulla (Med) from ApoE-Cre;Lrrc8alox/lox and control (Lrrc8alox/lox) mice. Pendrin served as marker for cortex and β-actin as loading control. Right, Western blot quantification. (C) Body weight of control and ApoE-Cre 11- to 12-week-old siblings. (D) Assessment of ApoE-Cre-driven LRRC8A deletion by immunofluorescence (IF), using HA labeling (red) of kidney sections from ApoE-Cre;Lrrc8aHAlox/HAlox mice. Lotus tetragonolobus Lectin (LTL), marker (green) for apical membranes of PTs. Cortex (CTX) and outer medulla (OM) indicated below images. Scale bar, 200 μm. (E) Upper panel, chimeric deletion of LRRC8A-HA in ApoE-Cre;Lrrc8aHAlox/HAlox mice detected by IF; absence of basolateral LRRC8A-HA (red) in some (#) and presence in other (§) cells of the same PT (*) identified by LTL (green). Lower panel, chimeric deletion of LRRC8A in glomerulus (G) and endothelial cells labeled with CD102 (green); absence of LRRC8A-HA shown by # and LRRC8A-HA expression in endothelial cells of control by §. Nuclei are DAPI stained (blue). Scale bar, 5 μm. (F) Upper panel, Masson’s trichrome staining of cortex from control and ApoE-Cre mice. ApoE-Cre mice displayed tubular injury with mild fibrosis (blue), and swollen cells (black arrowheads). Lower panel, periodic acid–Schiff staining indicated hyaline casts (#). Scale bar, 20 μm. (G) Daily water intake of ApoE-Cre and control mice. (H) Volume and osmolarity of 24-hour urine of ApoE-Cre and control mice with water ad libitum (Ctrl) or under 24-hour water restriction (WD). Bars, mean±SEM, **P<0.01, ***P<0.001 (Mann–Whitney U test). Images are representative of at least three mice per genotype.
