Figure 5.

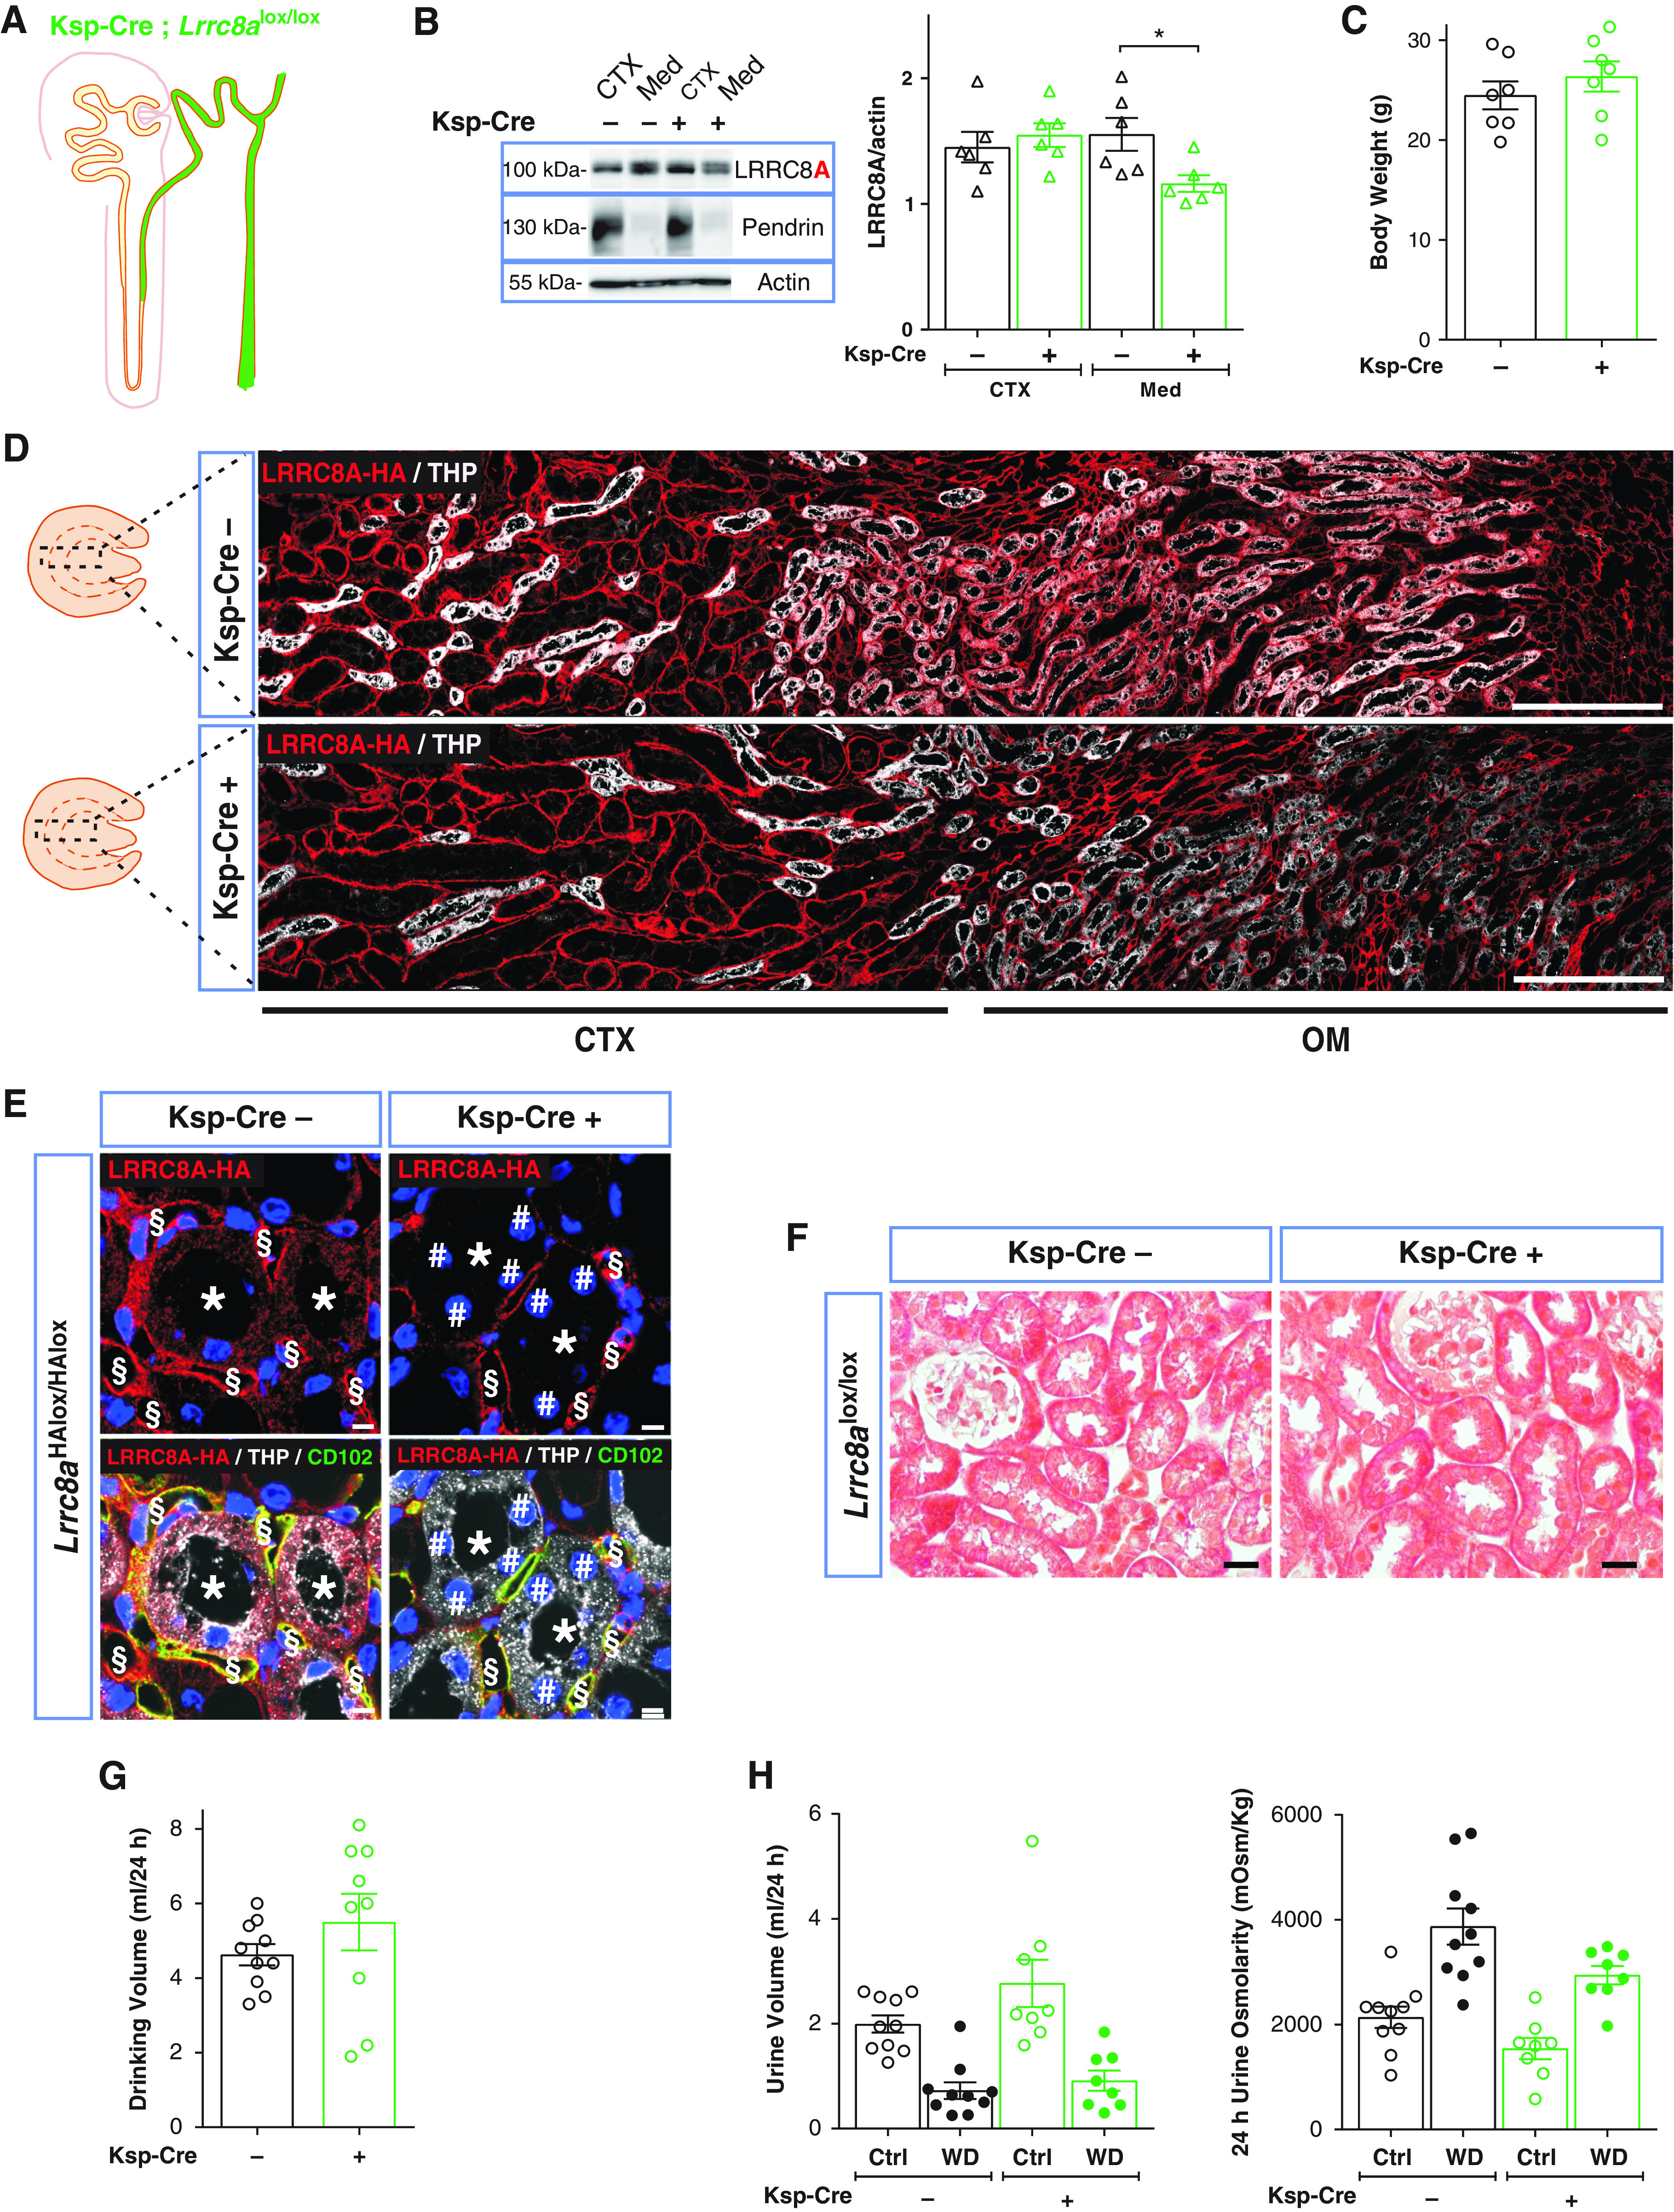
Distal deletion of LRRC8A by Ksp-Cre does not affect urine concentration ability. (A) Sketch of Ksp promoter-driven Cre expression. (B) Left, Western blot analysis of LRRC8A expression in cortex (CTX) and medulla (Med) in Ksp-Cre;Lrrc8alox/lox and control (Lrrc8alox/lox) mice. Pendrin, cortex marker; β-actin, loading control. Right, Western blot quantification. (C) Body weight of control and Ksp-Cre 11- to 12-week-old siblings. (D) Assessment of Ksp-Cre-driven LRRC8A deletion by HA labeling (red) of kidney sections from Ksp-Cre;Lrrc8aHAlox/HAlox mice. TALs labeled (in white) for apical Tamm–Horsfall protein (THP). Approximate extension of cortex and outer medulla indicated below. Scale bar, 200 μm. (E) Efficient deletion (#) of HA-tagged LRRC8A (red) in TAL (*; labeled in white with THP in lower panels) in Ksp-Cre;Lrrc8alox/lox mice. Note the faint red LRRC8A-HA staining in control, which is absent from Ksp-Cre tubules. Ksp-Cre did not delete in blood vessels (detected with endothelial CD102 [in green, §]). Nuclei are DAPI stained (blue). Scale bar, 5 μm. (F) Masson’s trichrome staining of kidney cortex fails to detect fibrosis. Scale bar, 20 μm. (G) Daily water intake of Ksp-Cre;Lrrc8alox/lox and control mice. (H) Volume and osmolarity of 24-hour urine of Ksp-Cre and control mice with water ad libitum (Ctrl) or under 24-hour water restriction (WD). Bars, mean±SEM, *P<0.05 (Mann–Whitney U test). Pictures are representative of at least three mice per genotype.
