Figure 4.

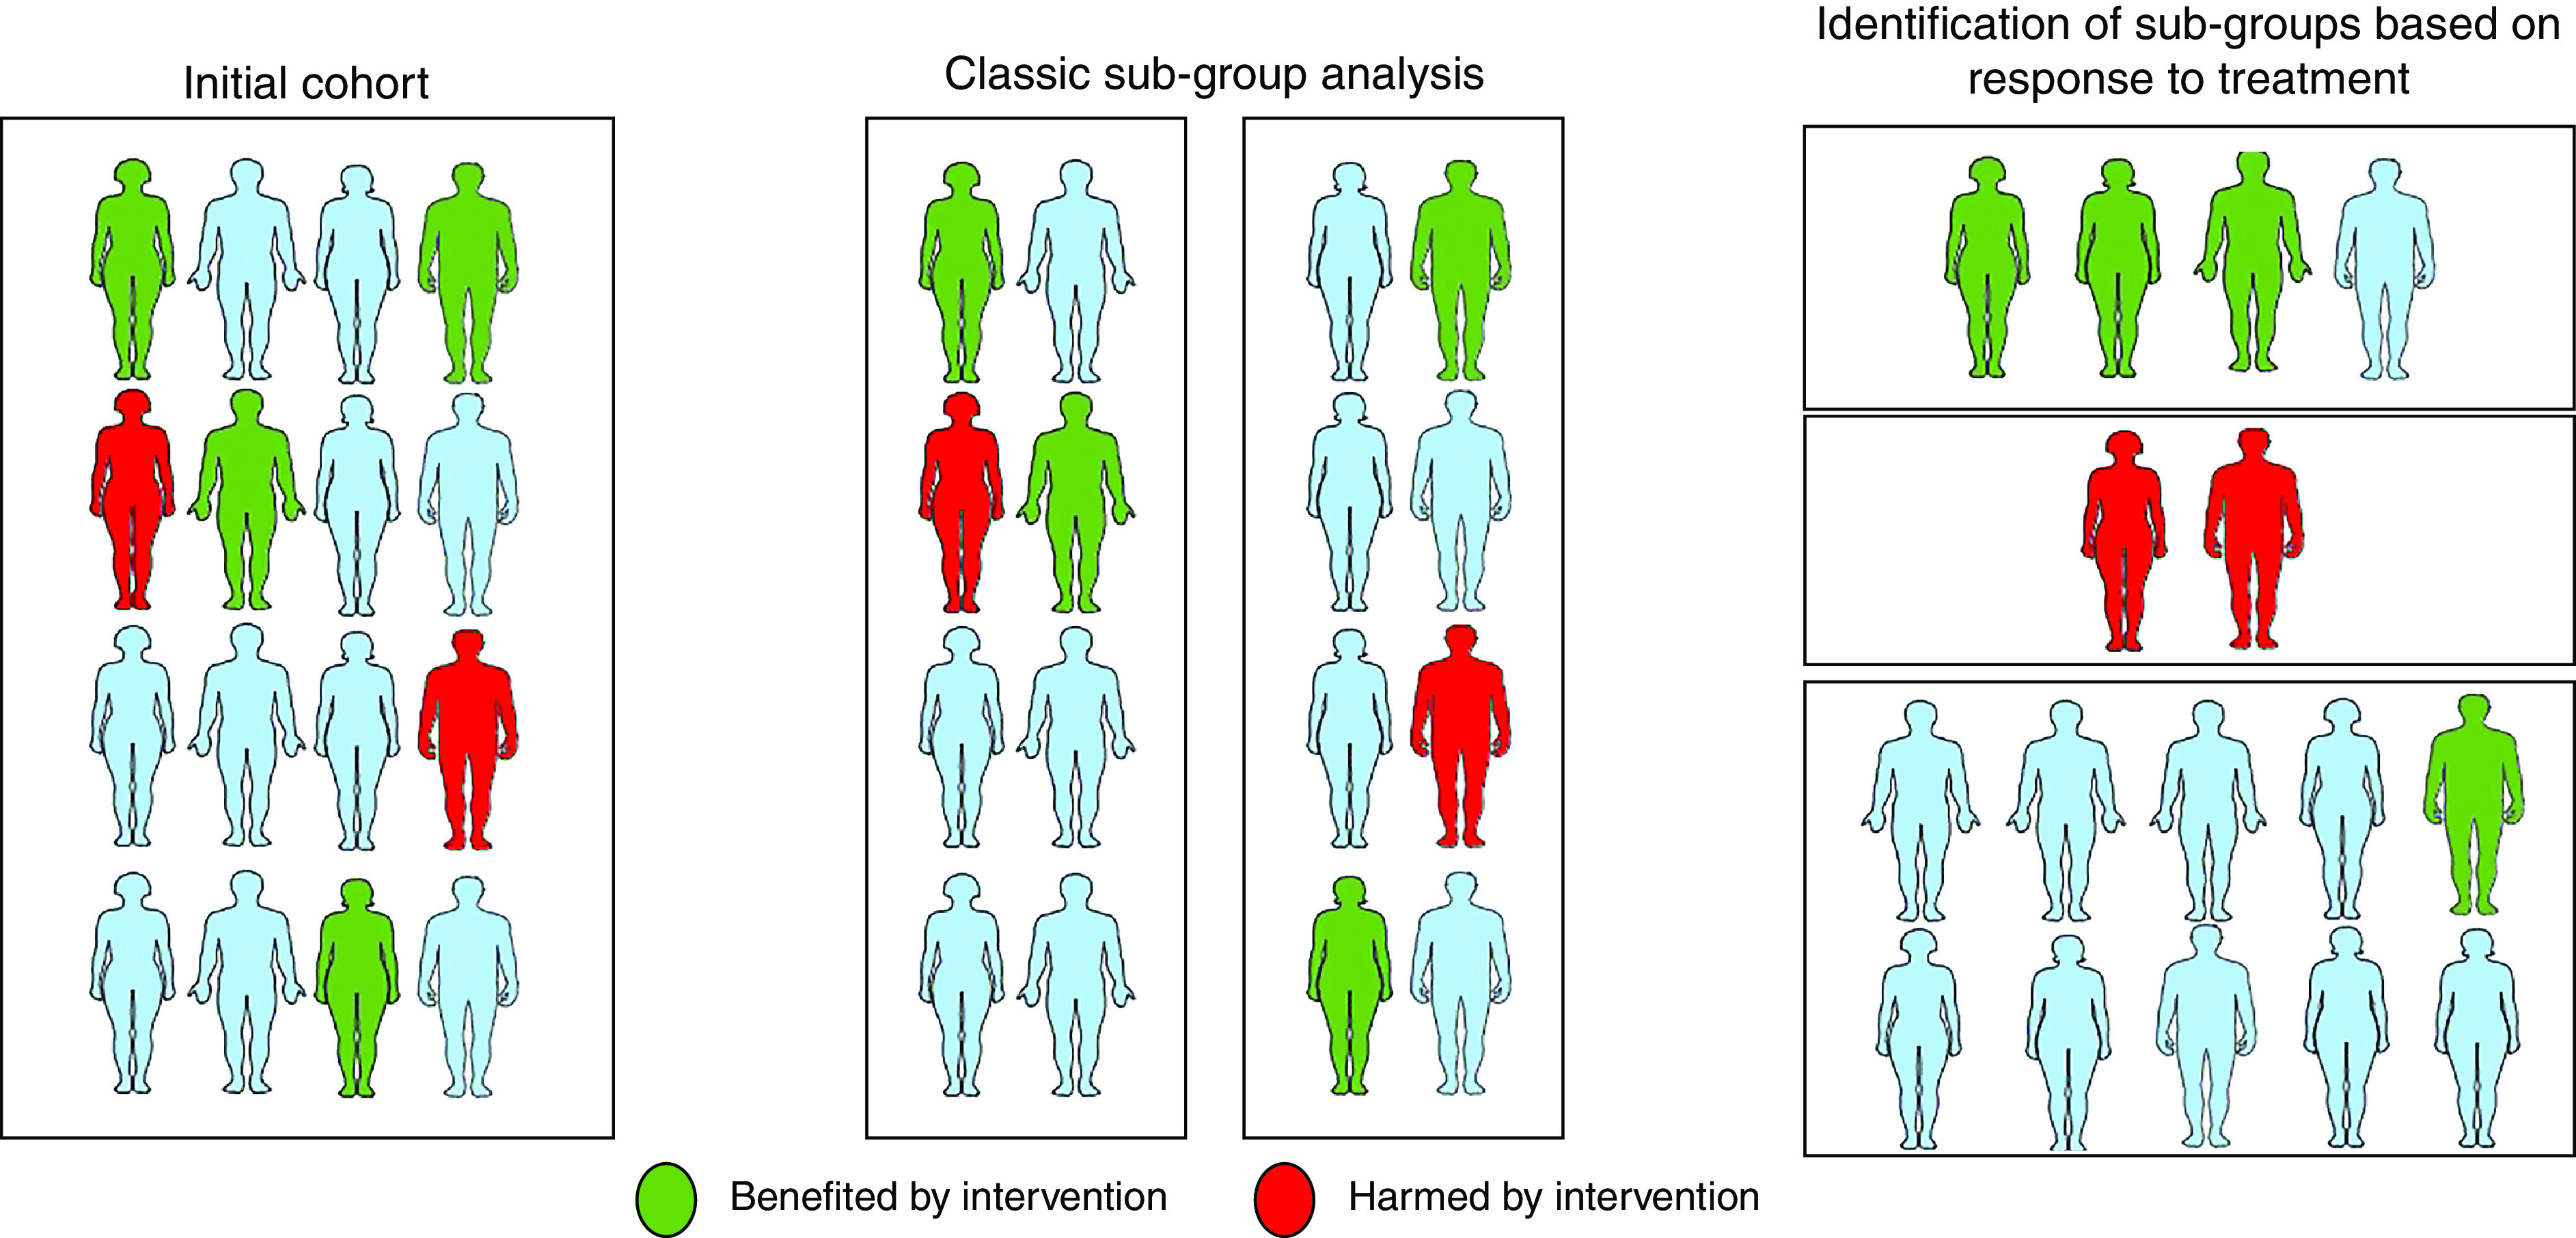
Graphical representation of heterogeneity of treatment effect in a trial population. The left panel shows how overall treatment responses may vary in the full trial population. The middle panel shows how subgroup analyses in randomized trials can fail to capture heterogeneity in treatment effects in a trial using classic subgroup analysis. The right panel shows how machine learning and other newer statistical methods may be used to estimate the treatment effects at the individual level.
