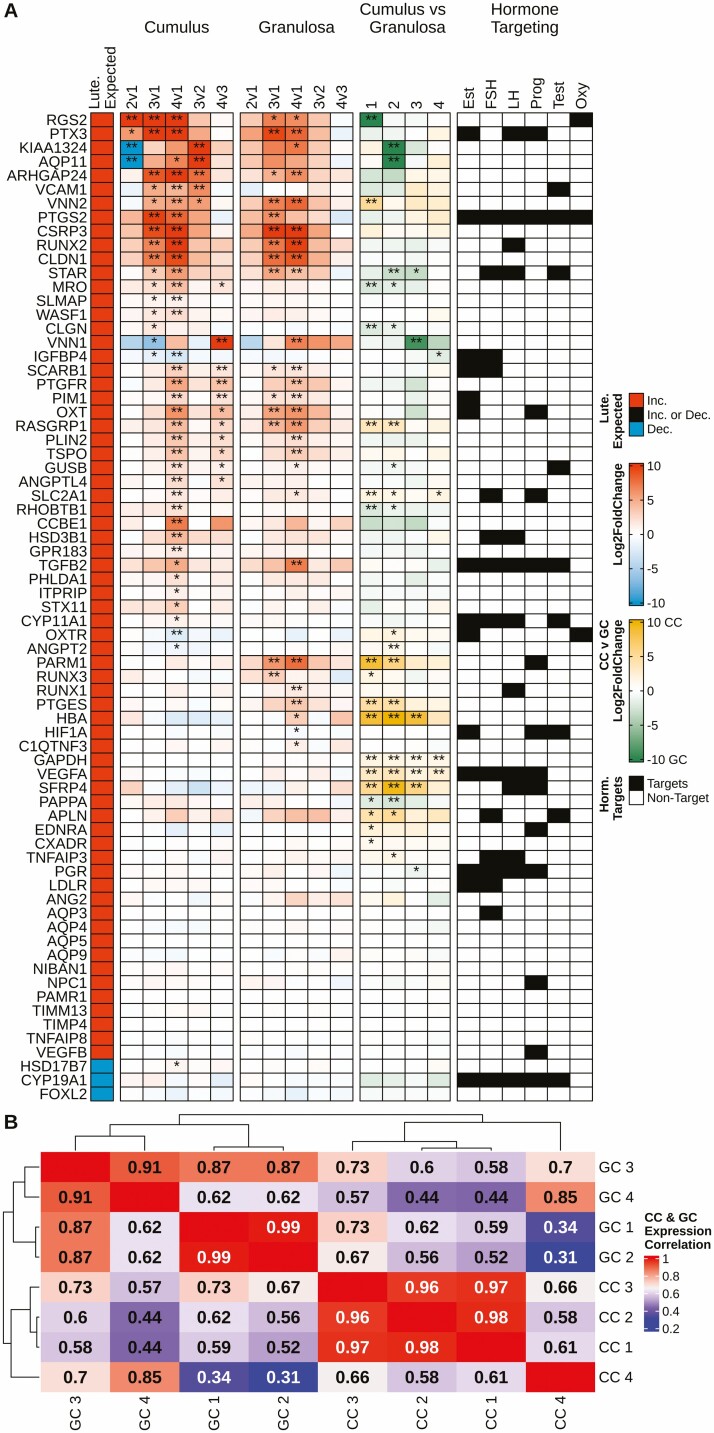
Figure 2.
Overview of gene expression changes for manually curated luteinization markers identified from the literature. (A) Five columns exploring the changes in luteinization marker expression in cumulus and granulosa cell samples. (A) Column 1 depicts the expected change in expression during luteinization, wherein red fill denotes an increase in expression, blue a decrease. (A) Columns 2 and 3 depict the changes in expression of markers in cumulus and granulosa cells, respectively, from different follicle types; fill of any color denotes log2 (fold-change), red equating to an increase and blue a decrease in expression. (A) Column 4 depicts the difference in marker expression when comparing cumulus and granulosa cells within follicle type; yellow fill denotes higher expression in cumulus cells and green higher expression in granulosa cells. (A) Column 5 identifies which of the markers are targets of hormones per the IPA database. (A) Columns 2-4, DEG status is denoted by **FDR < 0.01 and *FDR < 0.05. (B) A correlation heatmap with hierarchical clustering based on the average FPKM of the luteinization markers for both cumulus and granulosa cells among the 4 follicle types. Red fill indicates a higher correlation of expression values, while blue denotes less correlation. CC, cumulus cell; GC, granulosa cell. Data were generated from Tables S2 and S3 (32).

