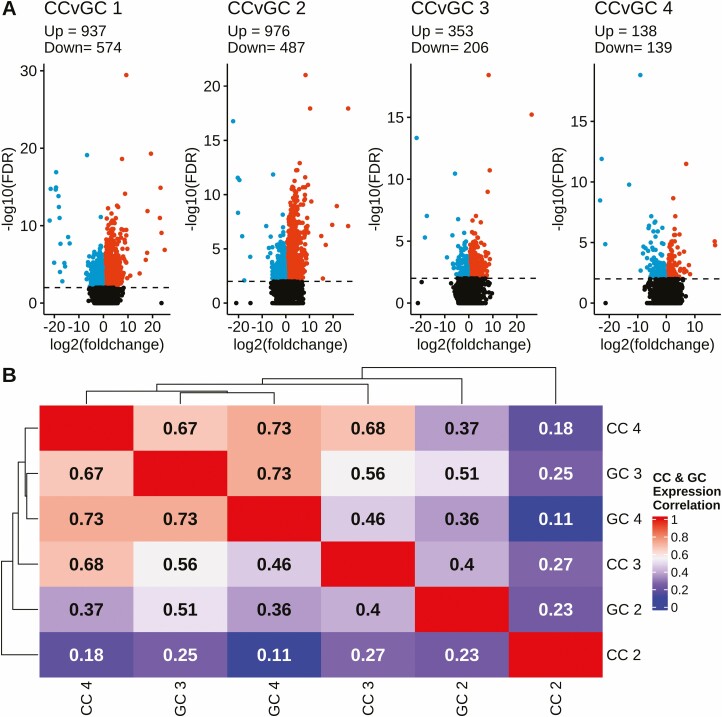
Figure 3.
Volcano plots comparing DEGs in cumulus and granulosa cells for each follicle type (1-4) and correlation heatmap with applied hierarchical clustering of expression values for cumulus and granulosa cells. (A) Each plot displays DESeq2 results (–log10 [FDR]) and represents the DEGs in the cumulus and granulosa cells within a follicle type. DEGs were called at a significance threshold greater than 2.0 (FDR < 0.01), denoted by horizontal dashed line. Point color key: Black = non-DEG, Red = upregulated DEGs, Blue = downregulated DEGs. CC = cumulus cells and GC = granulosa cells. (B) Within cumulus and granulosa cell types, FPKM values for follicle Types 2 to 4 were normalized against those for Type 1 as the denominator. The correlation between the types were calculated via the Pearson method. Color denotes correlation coefficient: red equating to more similar, and blue less similar. All data were generated from Tables S2 and S3 (32).

