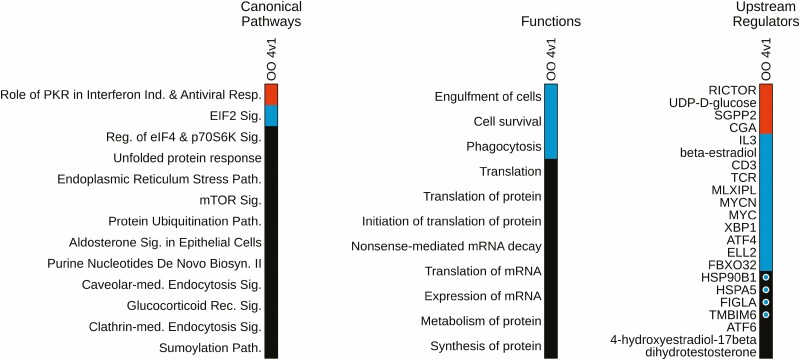
Figure 5.
Oocyte IPA pathway, regulator, and function heatmap. Heatmaps depict significantly affected canonical pathways, biological functions, and upstream regulators for the follicle Type 4 vs 1 comparison in oocytes. Colored fill for cells in heat maps denote z-score: red = activated, blue = inhibited, black = no significant z-score. Within the Upstream Regulator panel, the circles within colored fills denote regulators that are also differentially expressed: blue = downregulated. Data generated from Tables S5-S7 (32).

