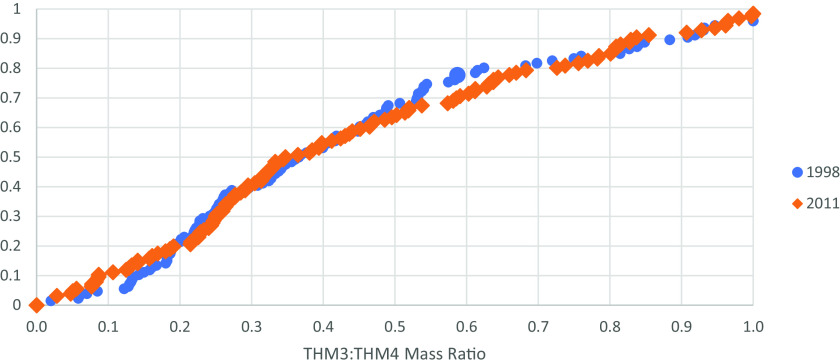
Figure 5.
Cumulative distribution for the mass-based ratio of THM3 (i.e., brominated THMs) to THM4 for common systems between 1998 and 2011 data sets (). Researchers calculated mass-based ratio for each system from the 1997–1998 Information Collection Rule data set that provided both THM3 and THM4 concentrations and compared to matching ratio from 2011 Six-Year Review 3 data set. Statistical testing performed using R (version 4.1.2; R Development Core Team) for the hypothesis that the means and variances were not different. See Excel Table S9 for underlying data. Note: THM3, three brominated species of THM4; THM4, trihalomethane-4.

