
Fig 1.
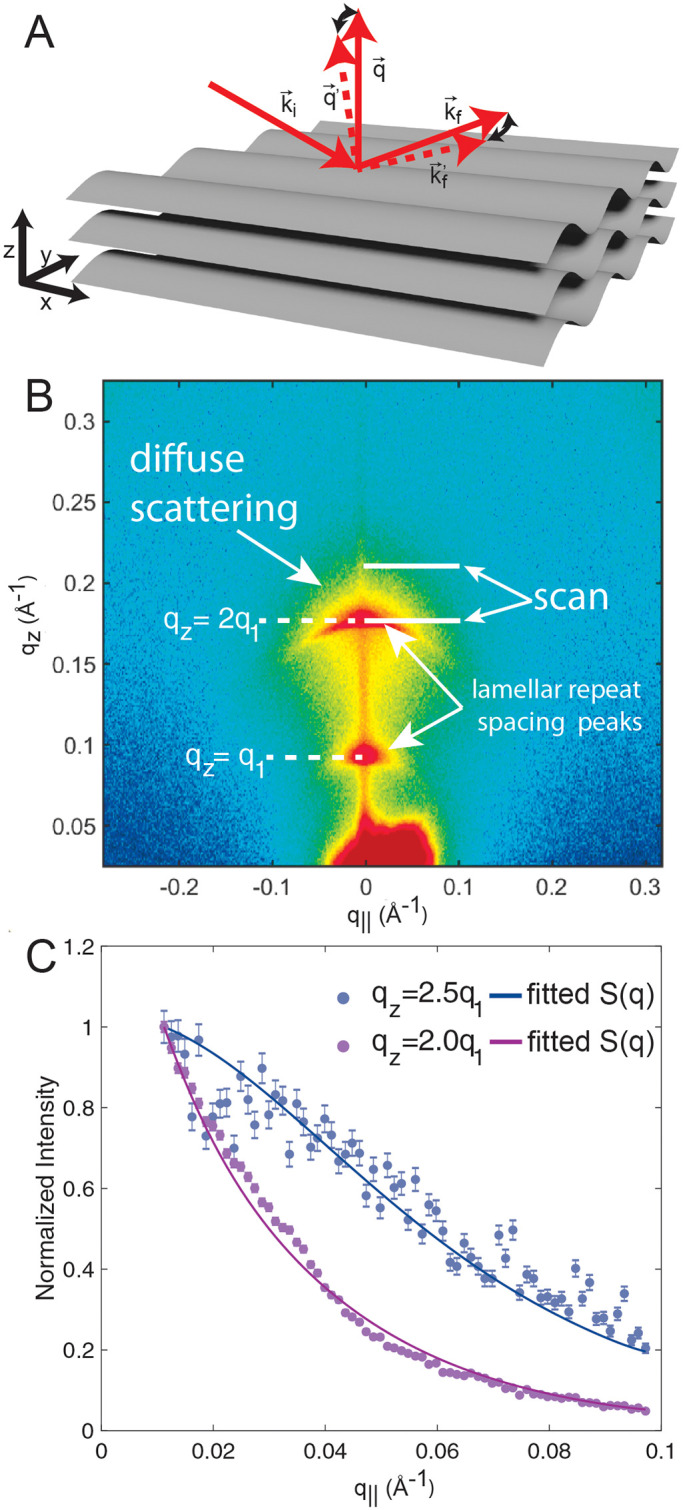
A Schematic of a stack of fluctuating membranes and the geometry of specular (q|| = 0) and off-specular (q|| ≠ 0) X-ray scattering. B q-space X-ray intensity map of a solid supported RBCcm membrane stack, measured at 37°C. Two orders of lamellar peaks surrounded by diffuse X-ray intensity are visible. The white lines show the locations and ranges of the data used for fits. C Off-specular intensities at qz = 2q1 and qz = 2.5q1, normalized to the respective X-ray intensity at q|| = 0.01 Å−1). Fits of the structure factor S(qz, q||) following Eq (1) are shown as solid lines. Error bars represents the ± standard deviation. Intensity measured in proximity of a lamellar peak is orders of magnitude higher than intensity measured in between lamellar peaks. Since errors in scattering experiments scale with the square root of counted X-ray photons, the relative error is consequently smaller in proximity of a lamellar peak than between lamellar peaks.