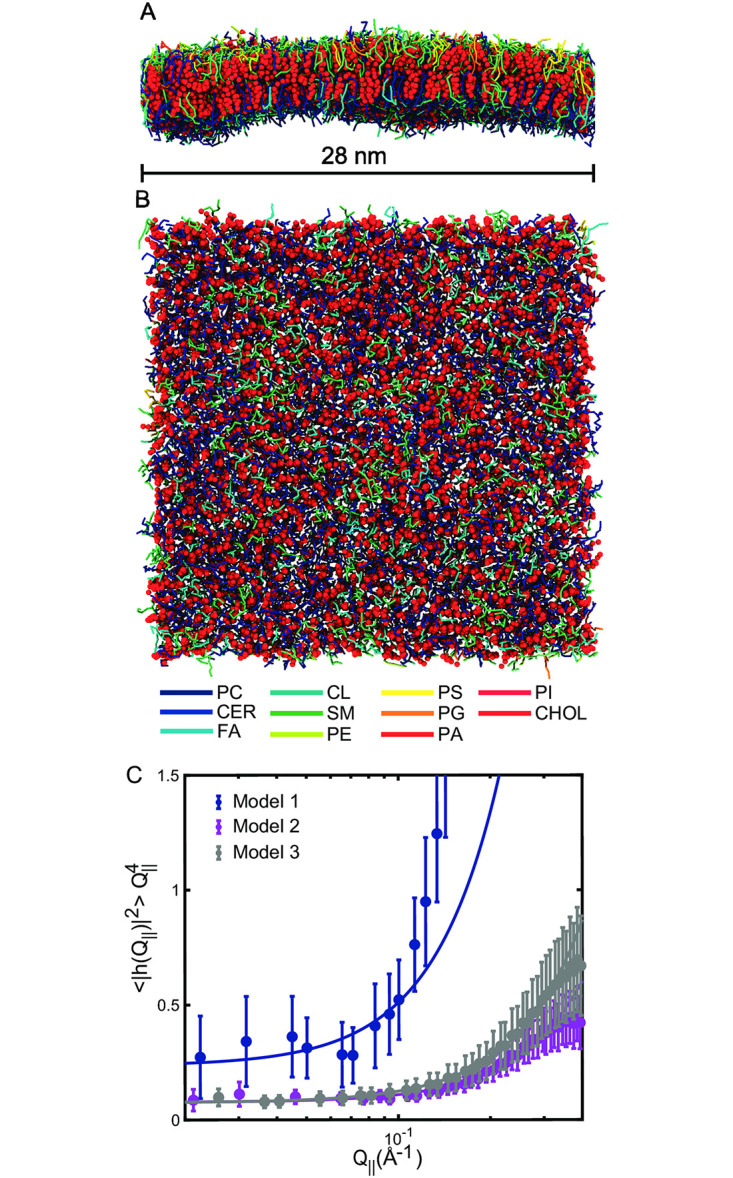
Fig 3. Three-dimensional renderings of the undulation simulation after 5 μs (side-view A and top-view B).

Lipid molecules are represented by rods representing intra-molecular bonds. Each lipid species (Phosphatidylcholine, PC; Ceramide, CER; Monoglucosyl lipids, MG; Diacylglycerol lipids, DG; Fatty acids, FA; Sphingomyelin, SM; Phosphatidylethanolamine, PE; Phosphatidylserine, PS; Phosphatidylglycerol, PG; Phosphatidic acid, PA; Phosphatidylinositol, PI) are represented by different colors indicated in the legend. Cholesterol (CHOL) is symbolized by red spheres. C The fluctuation spectrum determined from the undulation simulation averaged over the last 4 μs for all three models. Fits of Eq (8) to the data are depicted as red solid line. The fit range was Q<0.2 Å−1. (Error bars represents the ± standard deviation).
