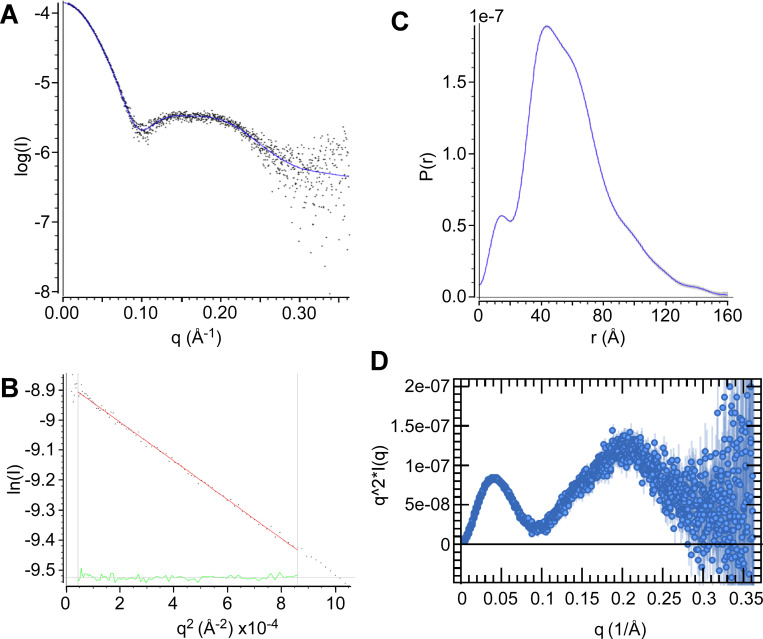
Fig 6. Small angle X-ray scattering of mature FopA.
(A) Experimental scattering curve of FopA (black dots) and fit (blue line). (B) Guinier analysis in Primus [40]. (C) Pair distance distribution function of FopA calculated by GNOM [41] from the experimental scattering curve. (D) Kratky plot with a characteristic peak suggesting correct folding, followed by a second peak which could imply either flexibility or effect of detergent belt surrounding the protein, a common signal in membrane protein analyses.

