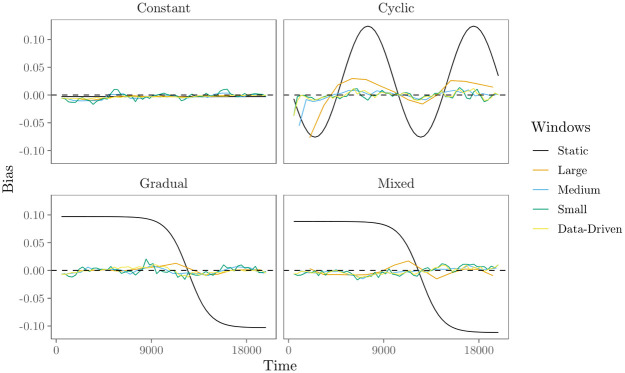
Fig 5. Bias for the ‘transitivity’ effect in the evaluation of the moving window REM.
Panels refer to the four time-varying effect scenarios. Solid lines represent the bias of the parameter estimates over time, with colors representing estimation with large (4000t), medium (2000t), small (1000t) and data-based window widths.

