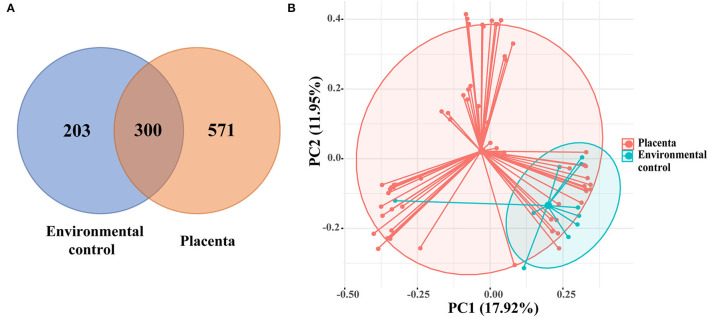
Figure 1.
(A) The Venn diagram showed the shared operational taxonomic units (OTUs) among placental and environmental control samples. (B) Principal coordinate analysis (PCoA) analysis of the microbiota between placental and environmental control samples based on the Bray-Curtis distance matrix. Each point corresponds to a sample colored by the group (placenta and environmental control).

