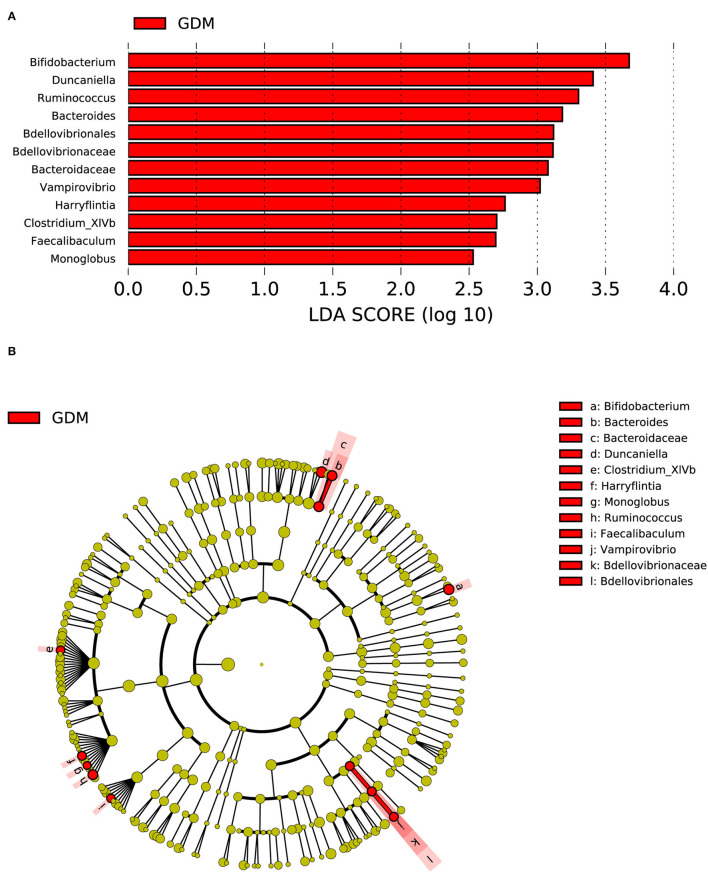
Figure 4.
Distinct bacterial taxa for the placental microbiota between the group with GDM and the healthy control group was identified by the LEfSe analysis. (A) A histogram of the linear discriminant analysis (LDA) scores represents significant differences in the abundance of the bacterial taxa between the GDM group and the healthy control group. (B) A cladogram for taxonomic representation representing distinct bacterial taxa between the two groups. Red color indicates enrichment in the GDM samples. The diameter of each circle is proportional to the taxon's abundance.

