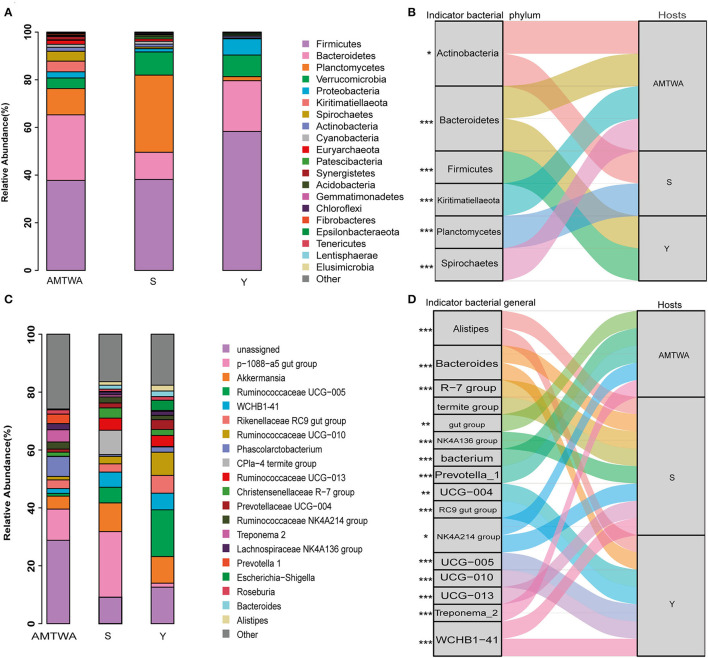
Figure 2.
The relative abundances of gut microbiota and indicator species among animal hosts. Relative abundances of the 20 most abundant phyla (A) and genera (C) in different hosts are aggregated and colored on stack graphs. Low abundance taxa are grouped together and labeled “other.” Indicator phyla (B) and genera (D) related to each hosts are traced by Sankey plots. Line represent associations between indicator taxa and hosts. Different colors represent different taxa. Line width is scaled to reflect indicator value. Higher indicator values for each taxon are more strongly associate with different hosts. Indicator values are shown in Supplementary Figure 2. The genera R-7 group, termite group, gut group, NK4A136 group, bacterium, UCG-004, RC9 gut group, NK4A214 group, UCG-005, UCG-010 and UCG-013 are represent Christensenellaceae R-7 group, CPla-4 termite group, p-1088-a5 gut group, Ruminococcaceae NK4A136 group, Phascolarctobacterium, Prevotellaceae UCG-004, Rikenellaceae RC9 gut group, Ruminococcaceae NK4A214 group, Ruminococcaceae UCG-005, Ruminococcaceae UCG-010 and Ruminococcaceae UCG-013, respectively. The statistical P-values mean the taxa associated with hosts. *P < 0.05, **P < 0.01, ***P < 0.001.

