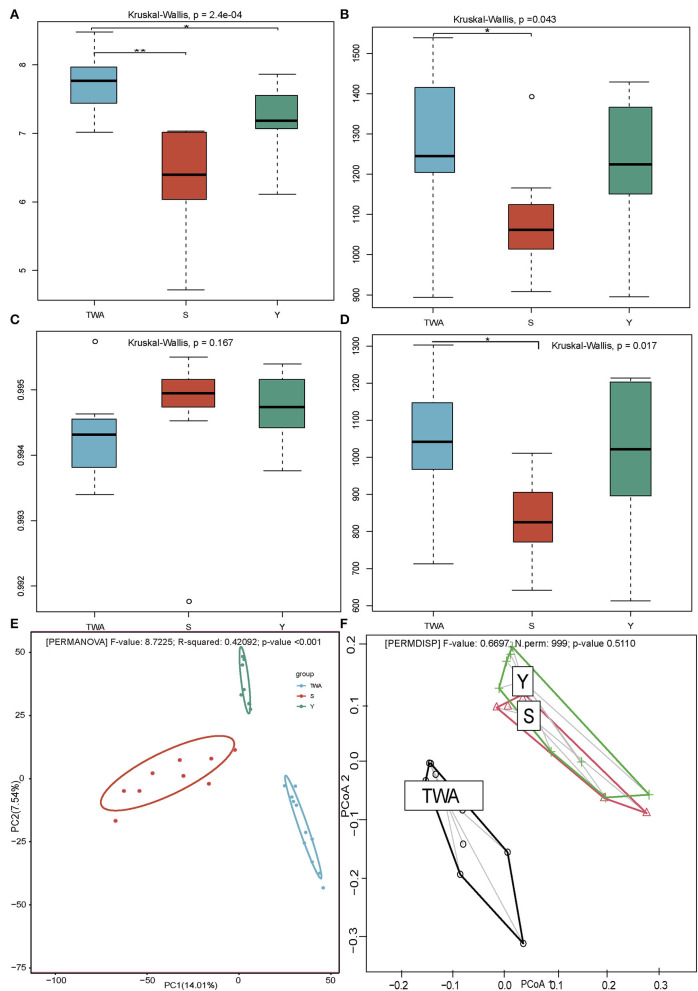
Figure 3.
Diversity metrics of gut microbiota communities among TWA, S, and Y. Shannon diversity (A), Chao1 index (B), Good's coverage (C), and PD whole (D) indices represented by boxplots. PCoA (E) plots show distributions of samples based on Bray-Curtis distance matrix. Significant differences are evaluated by PERMANOVA with P < 0.01. Percent variation explained by each principal coordinate is indicated next to corresponding axis. Homogeneity of dispersions (F) for this diversity metric is also tested to identify differences in variance among treatments. Significant differences are determined using 999 permutations of the betadisper function in the vegan v. 2.5-6 package of R. All boxplots distribution are tested by non-parametric Kruskal–Wallis and Dunn post hoc tests with FDR-corrected P-value, boxplots center values indicate the median, and whiskers represent 0.75 times the interquartile range. * < 0.05, ** < 0.01, no * mean no significant difference.

