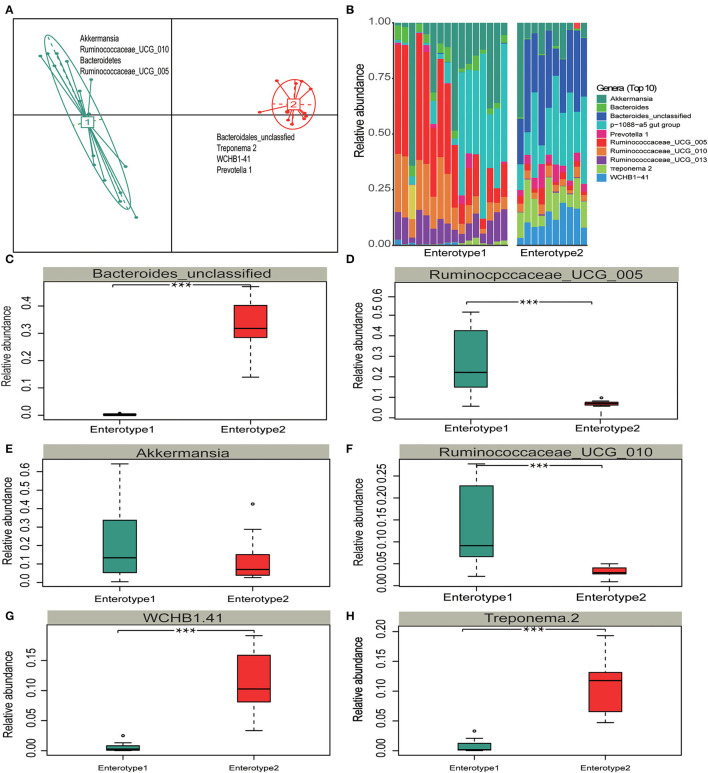
Figure 5.
Enterotype distributions of gut microbiota associated with different hosts using Bray-Curits dissimilarity. Identification of gut enterotypes is shown in Supplementary Figure 1. (A) Visualizations of enterotypes, indentified by PAM (partitioning around medoid) clustering. (B–H) Relative abundances of bacterial taxa characteristic of each enterotype. Ten genera were selected based on their average contributions to the overall Bray-Curtis dissimilarity. All four bacterial genera are shown in Supplementary Figure 3. All boxplots distributions are test by Mann-Whitney U-test with FDR-corrected P-value, box-plots center values indicate the median, and whiskers represent 0.75 times the interquartile range. *** < 0.001, no * mean no significant difference.

