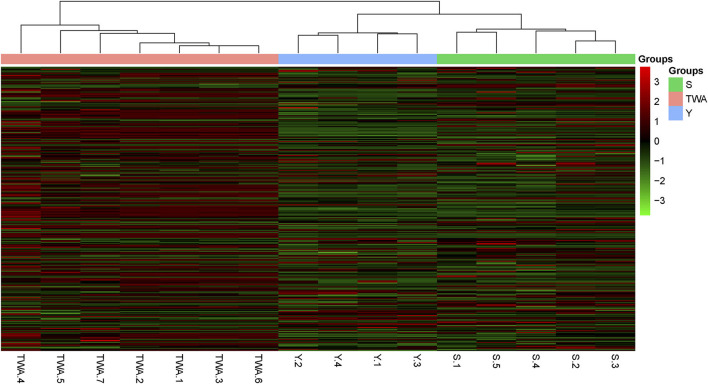
Figure 8.
Heatmap visualization of the distribution of non-redundant genes among samples. Heatmap based on hierarchical clustering solution (Euclidean distance) of 16 samples. Rows represents 286 glucoside hydrolase family genes. Columns represent 16 samples. Relative abundance of each gene is normalized [log2 (data+1)] and displayed in rows of cells.

