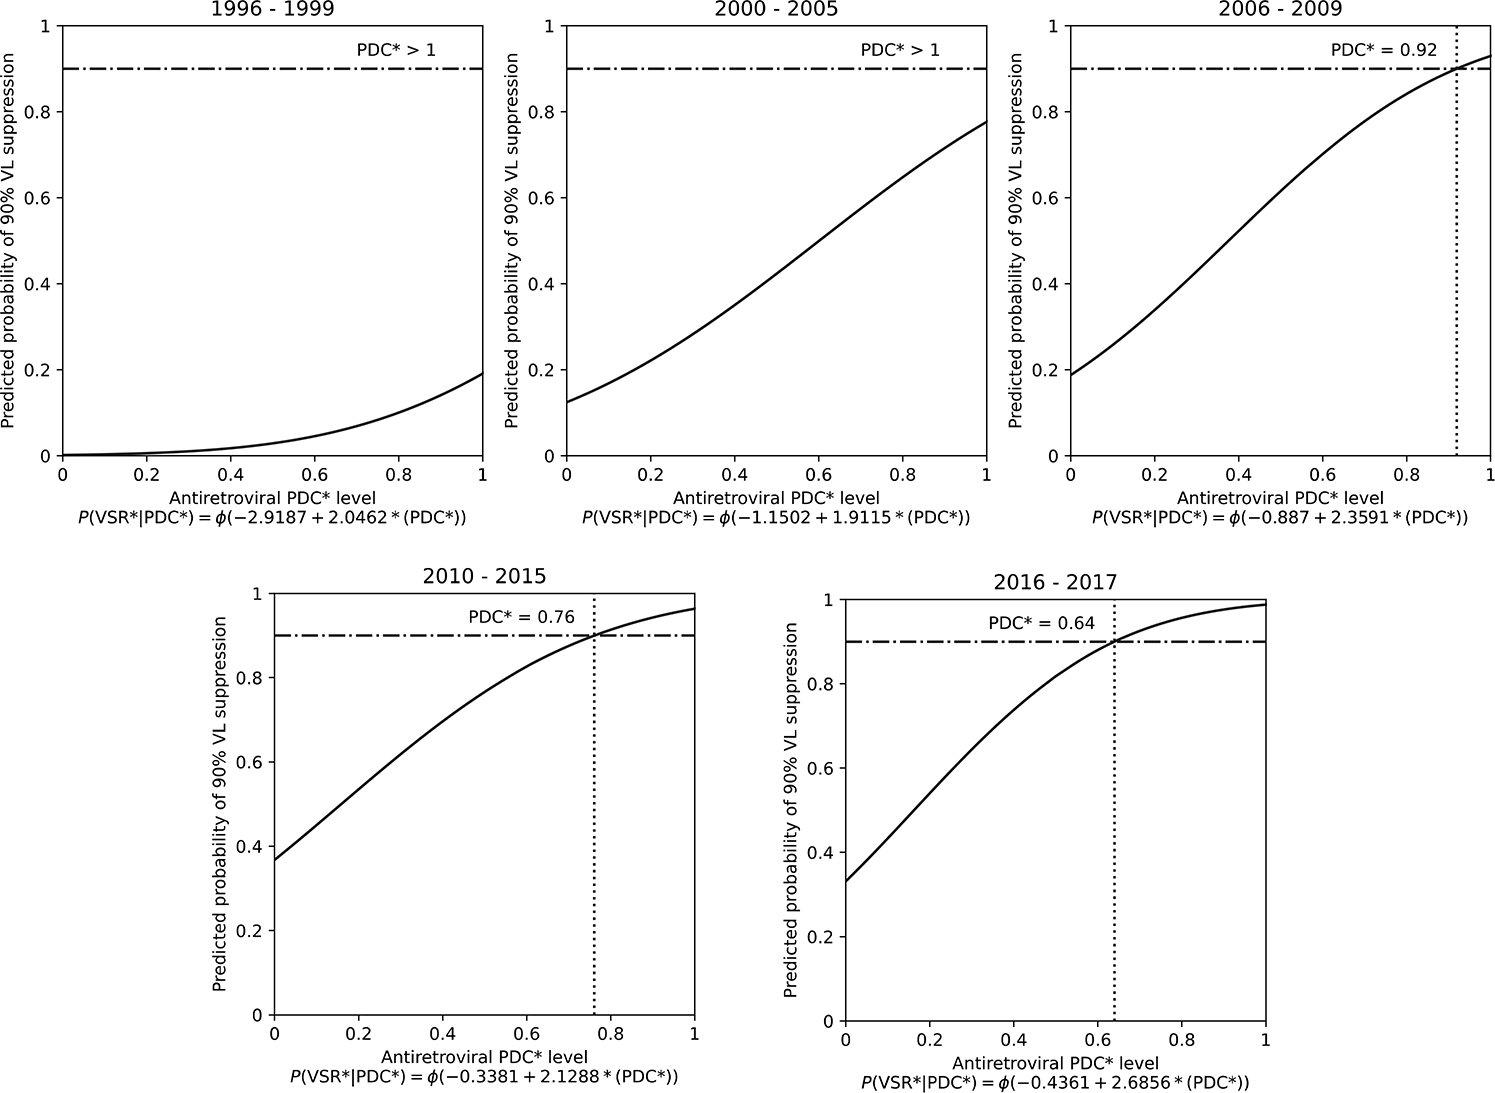
Figure 2. Estimation of the minimum adherence level needed to produce HIV VL suppression in 90% of tests by calendar-year of observation, among 837 PHLIV-PWUD in Vancouver, Canada, 1996–2017.

*PDC, proportion of days covered. The horizontal lines represent the 90% benchmark for viral suppression and the dotted vertical lines represent the PDC level at which 90% of HIV VL measures were suppressed (HIV RNA <200 copies/mL).
