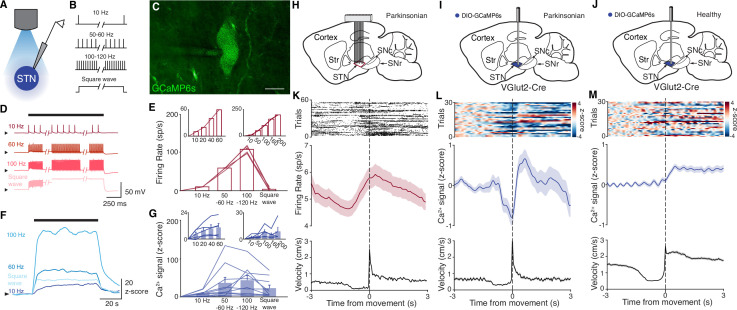
Figure 1. Subthalamic nucleus (STN) GCaMP signals correlate with spiking measured by electrophysiology.
(A–G) Combined ex vivo electrophysiological and calcium imaging recordings in STN neurons. Neurons were patched in the whole-cell current-clamp configuration. (A) Combined whole-cell/calcium imaging recording configuration. (B) Brief intracellular current pulses were provided at different frequencies up to 200 Hz and with prolonged depolarization (‘square wave’). (C) Image of GCaMP-expressing STN neuron (scale bar = 10 μm). (D) Representative STN neuron responses to intracellular current pulses at different frequencies and to prolonged depolarization (‘square wave’). (E) Average firing rate of STN neurons in response to stimulation at a range of frequencies and prolonged depolarization (n=10 cells, N=3 mice for main; n=5 cells, N=1 mouse for each inset). (F) Representative trace of z-scored STN GCaMP signal in response to current-clamp stimulation. (G) Average z-scored STN GCaMP signal in response to intracellular current pulses at a range of frequencies and prolonged depolarization (n=10 cells, N=3 mice for main; n=5 cells, N=1 mouse for each inset). Arrowhead in current-clamp traces and GCaMP traces corresponds to –75 mV and 0 z-score, respectively. Bar plots show mean ± SEM. (H–M) In vivo electrophysiological and GCaMP fiber photometry recordings in STN neurons from freely moving mice, aligned to movement starts. (H) Sagittal schematic showing multielectrode array implant in the STN or parkinsonian mice for single-unit electrophysiology. (I, J) Sagittal schematic showing STN GCaMP and fiber implant for photometry in parkinsonian (I) and healthy (J) mice. (K) Representative STN single-unit firing (top), average firing rate (middle), and average velocity (bottom) aligned to movement starts (n=17 cells, N=3 mice). (L, M) Representative STN fiber photometry signal (top), average fiber photometry signal (middle), and average velocity (bottom) aligned to movement starts in parkinsonian (L, N=8) and healthy (M, N=5) mice. Average firing rate, photometry, and velocity traces show mean ± SEM.
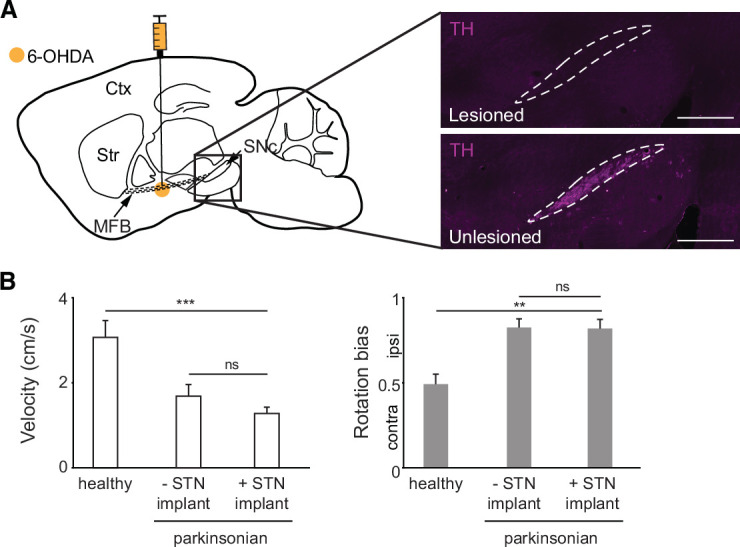
Figure 1—figure supplement 1. Hemiparkinsonian mice show decreased movement velocity and ipsilesional rotation bias.


