. 2022 Jul 4;11:e75253. doi: 10.7554/eLife.75253

Figure 2. Subthalamic nucleus deep brain stimulation (STN DBS) consistently increases STN activity.

(A) Experimental timeline. (B) Left: Sagittal schematic showing STN DBS and GCaMP fiber photometry. Right: Postmortem sagittal section showing GCaMP expression and estimated fiber placement in the STN (inset, scale = 500 μm). (C) Representative single-session velocity (black) and STN GCaMP signal (blue) in response to 60 Hz STN DBS. (D) Average velocity (top) and STN GCaMP signal (bottom) before, during, and after 60 Hz STN DBS (N=9 mice). (E) Representative single-session velocity (black) and STN GCaMP signal (blue) in response to 100 Hz STN DBS. (F) Average velocity (top) and STN GCaMP signal (bottom) before, during, and after 100 Hz STN DBS (N=9 mice). (G) Representative single-session velocity (black) and STN GCaMP signal (blue) before and after levodopa injection (dotted line). (H) Average velocity (top) and STN GCaMP signal (bottom) before, during, and after levodopa treatment (N=9 mice). (I) Representative single-session velocity (black) and STN single-unit activity (red) before and after levodopa injection (dotted line). (J) Average velocity (top) and STN single-unit activity (bottom) before, during, and after levodopa treatment (n=11 cells, N=3 mice). Statistical significance was determined using a one-way repeated measures ANOVA with a Tukey HSD post hoc analysis applied to correct for multiple comparisons; *p < 0.05, **p < 0.01, ***p < 0.001 (only comparison between pre and stim/LD shown, see Supplementary file 1, table 1 for detailed statistics). Arrowhead in velocity, GCaMP, and single-unit electrophysiology traces corresponds to 1 cm/s, 0 z-score, and 0 spike/s, respectively. Bar plots show mean ± SEM.

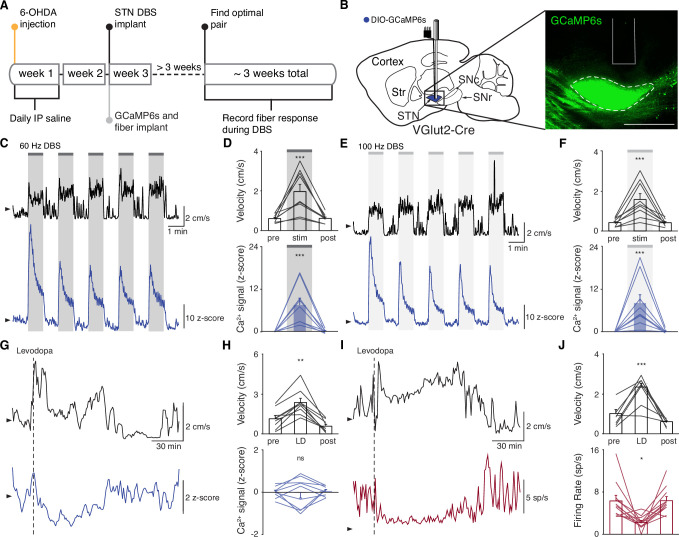
Figure 2.

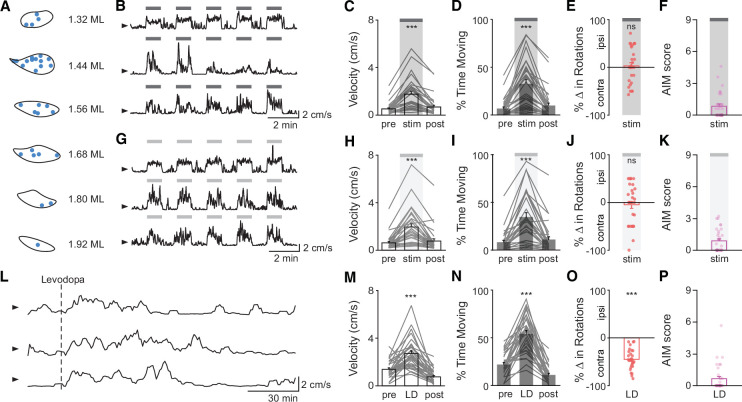
Figure 2—figure supplement 1. STN DBS and levodopa alleviate some motor signs in parkinsonian mice.

Figure 2—figure supplement 1.

(A) Targeting of subthalamic nucleus deep brain stimulation (STN DBS) electrodes to the STN in 32 mice. (B) Representative single-session velocities in response to 60 Hz STN DBS in three mice. (C) Binned average velocity, (D) percent time moving, (E) change in rotational bias, and (F) dyskinesia in response to 60 Hz STN DBS (N=32 mice). (G) Representative single-session velocities in response to 100 Hz STN DBS in three mice. (H) Binned average velocity, (I) percent time moving, (J) change in rotational bias, and (K) dyskinesia in response to 100 Hz STN DBS (N=31 mice). (L) Representative single-session velocities before and after levodopa injection (dotted line) in three mice. (M) Binned average velocity, (N) percent time moving, (O) change in rotational bias, and (P) dyskinesia in response to levodopa injection (N=30 mice). Dyskinesia was quantified with as the abnormal involuntary movement (AIM) score. Statistical significance was determined using a Wilcoxon signed-rank test (E,I,O); a one-way repeated measures ANOVA with a Tukey HSD post hoc analysis applied to correct for multiple comparisons (M–N); or a Friedman test with a Tukey HSD post hoc analysis applied to correct for multiple comparisons (C,D,H,I); ***p < 0.001 (for ANOVA/Friedman, only comparison between pre and stim/LD shown, see Supplementary file 1, table 1 for detailed statistics). Arrowhead in velocity traces corresponds to 1 cm/s. Bar plots show mean ± SEM.
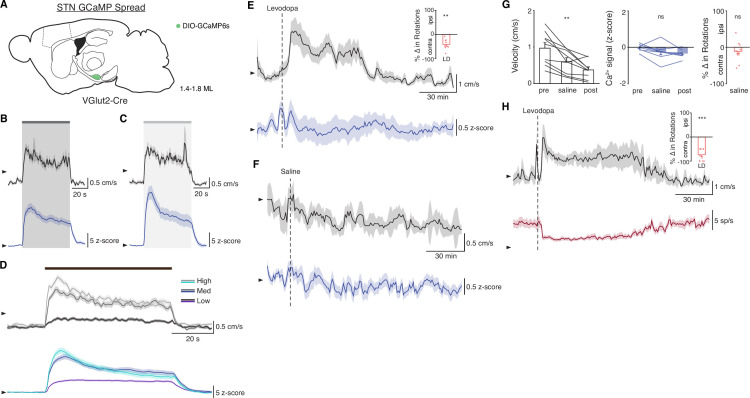
Figure 2—figure supplement 2. STN DBS increases STN activity in vivo.

Figure 2—figure supplement 2.

(A) Sagittal schematic showing estimated extent of viral GCaMP6s spread in the subthalamic nucleus (STN) of VGlut2-Cre mice (N=9 mice). (B–C) Average movement velocity over time (black) and STN GCaMP signal (blue) following 60 Hz STN deep brain stimulation (DBS) (B, N=9 mice) or 100 Hz STN DBS (C, N=9 mice). (D) Average movement velocity (top) and STN GCaMP signal (bottom) during DBS sessions grouped by stimulation frequency: Low = 5–40 Hz, Med = 60–100 Hz, High = 120–180 Hz stimulation. (E) Average movement velocity over time (black) and STN GCaMP signal (blue) following administration of levodopa (N=9 mice) and average change in rotation bias during levodopa (inset). (F) Average movement velocity over time (black) and STN GCaMP signal (blue) following administration of saline (N=9 mice). (G) Average velocity (left), STN GCaMP signal (middle), and change in rotation bias before, during, and after saline injection (N=9 mice). (H) Average velocity over time (black) and STN single-unit firing rate (red) following administration of levodopa (n=11 cells, N=3 mice) and average change in rotation bias during levodopa (inset). Statistical significance was determined using a Wilcoxon signed-rank test (D,F (right),G) or a one-way repeated measures ANOVA with a Tukey HSD post hoc analysis applied to correct for multiple comparisons (F (left, middle)); **p < 0.01, ***p < 0.001 (for ANOVA, only comparison between pre and saline shown, see Supplementary file 1, table 1 for detailed statistics). Arrowhead in velocity, GCaMP, and single-unit electrophysiology traces corresponds to 1 cm/s, 0 z-score, and 0 spike/s, respectively. Velocity traces, GCaMP traces, single-unit electrophysiology traces, and bar plots show mean ± SEM.