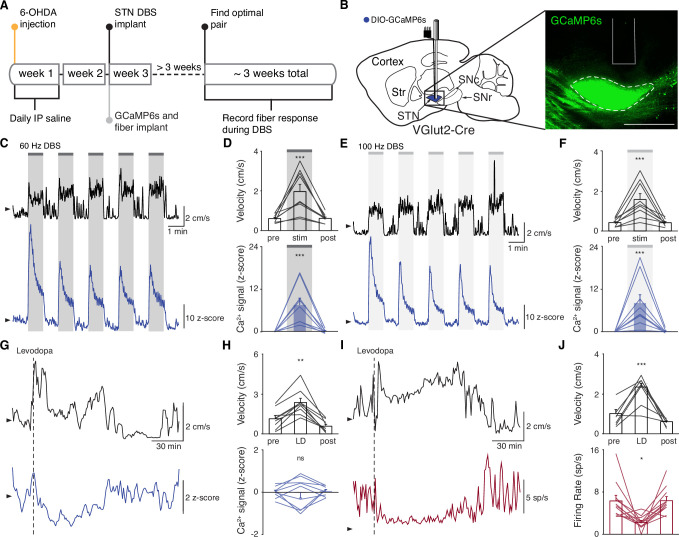
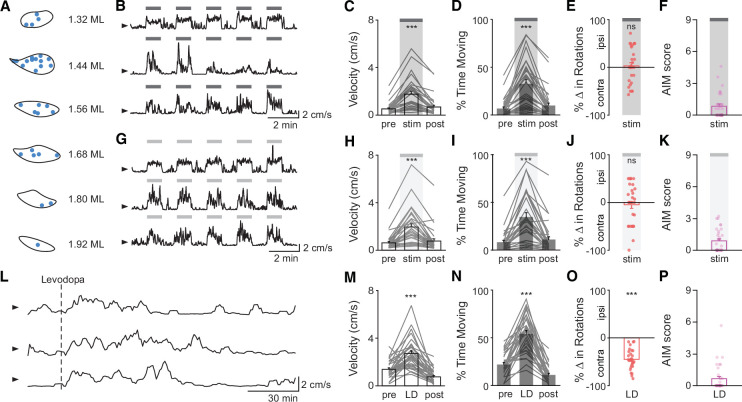
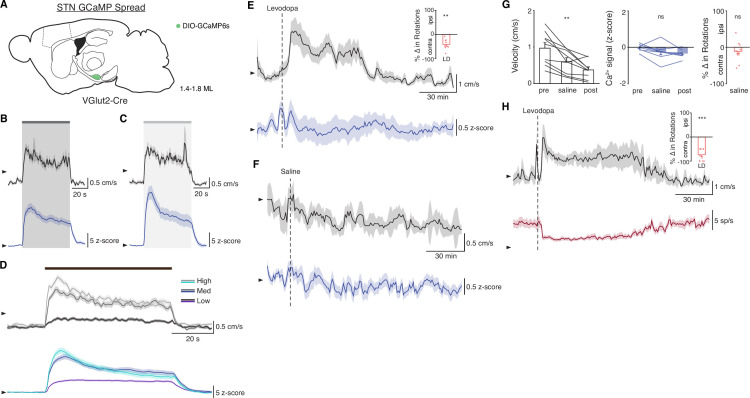
Figure 2. Subthalamic nucleus deep brain stimulation (STN DBS) consistently increases STN activity.
(A) Experimental timeline. (B) Left: Sagittal schematic showing STN DBS and GCaMP fiber photometry. Right: Postmortem sagittal section showing GCaMP expression and estimated fiber placement in the STN (inset, scale = 500 μm). (C) Representative single-session velocity (black) and STN GCaMP signal (blue) in response to 60 Hz STN DBS. (D) Average velocity (top) and STN GCaMP signal (bottom) before, during, and after 60 Hz STN DBS (N=9 mice). (E) Representative single-session velocity (black) and STN GCaMP signal (blue) in response to 100 Hz STN DBS. (F) Average velocity (top) and STN GCaMP signal (bottom) before, during, and after 100 Hz STN DBS (N=9 mice). (G) Representative single-session velocity (black) and STN GCaMP signal (blue) before and after levodopa injection (dotted line). (H) Average velocity (top) and STN GCaMP signal (bottom) before, during, and after levodopa treatment (N=9 mice). (I) Representative single-session velocity (black) and STN single-unit activity (red) before and after levodopa injection (dotted line). (J) Average velocity (top) and STN single-unit activity (bottom) before, during, and after levodopa treatment (n=11 cells, N=3 mice). Statistical significance was determined using a one-way repeated measures ANOVA with a Tukey HSD post hoc analysis applied to correct for multiple comparisons; *p < 0.05, **p < 0.01, ***p < 0.001 (only comparison between pre and stim/LD shown, see Supplementary file 1, table 1 for detailed statistics). Arrowhead in velocity, GCaMP, and single-unit electrophysiology traces corresponds to 1 cm/s, 0 z-score, and 0 spike/s, respectively. Bar plots show mean ± SEM.


