
Figure 4. Subthalamic nucleus deep brain stimulation (STN DBS) variably changes hyperdirect M1 neural activity.
(A) Left: Sagittal schematic showing STN DBS and M1-STN GCaMP fiber photometry. Right: Postmortem sagittal section showing GCaMP expression and estimated fiber placement in M1 (inset, scale = 500 μm). (B) Representative single-session velocity (black) and M1-STN GCaMP signal (green) in response to 60 Hz STN DBS. (C) Average velocity (top) and M1-STN GCaMP signal (bottom) before, during, and after 60 Hz STN DBS (N=9 mice). (D) Representative single-session velocity (black) and M1-STN GCaMP signal (green) in response to 100 Hz STN DBS. (E) Average velocity (top) and M1-STN GCaMP signal (bottom) before, during, and after 100 Hz STN DBS (N=8 mice). Statistical significance was determined using a one-way repeated measures ANOVA with a Tukey HSD post hoc analysis applied to correct for multiple comparisons; ***p < 0.001 (only comparison between pre and stim shown, see Supplementary file 1, table 1 for detailed statistics). Arrowhead in velocity and GCaMP traces corresponds to 1 cm/s and 0 z-score, respectively. Bar plots show mean ± SEM.
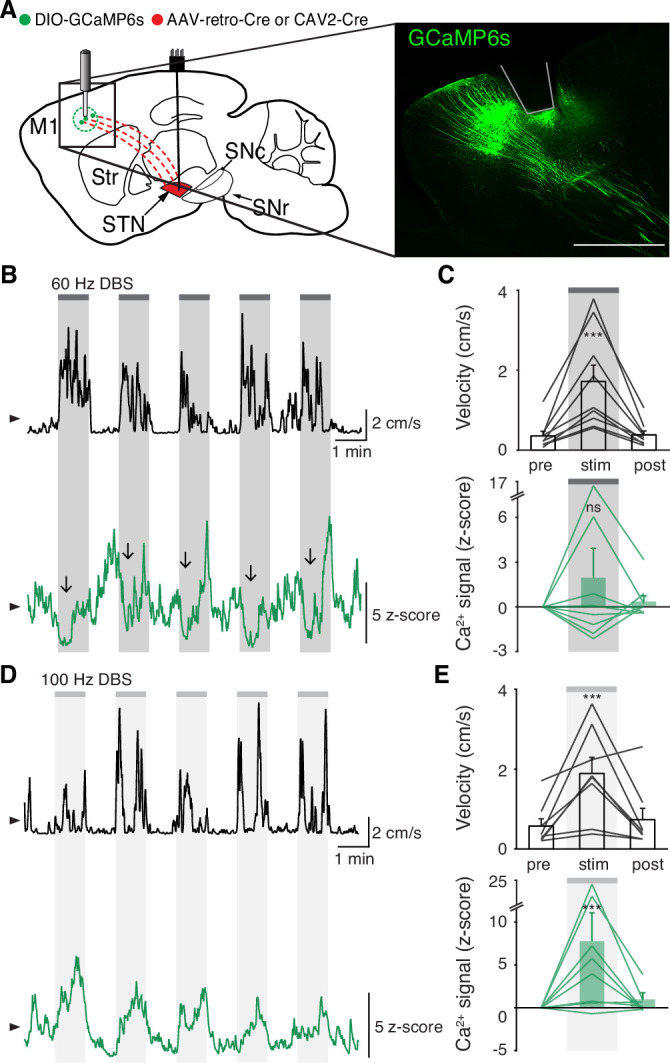
Figure 4—figure supplement 1. STN DBS drives variable and slow changes in hyperdirect M1 activity.
