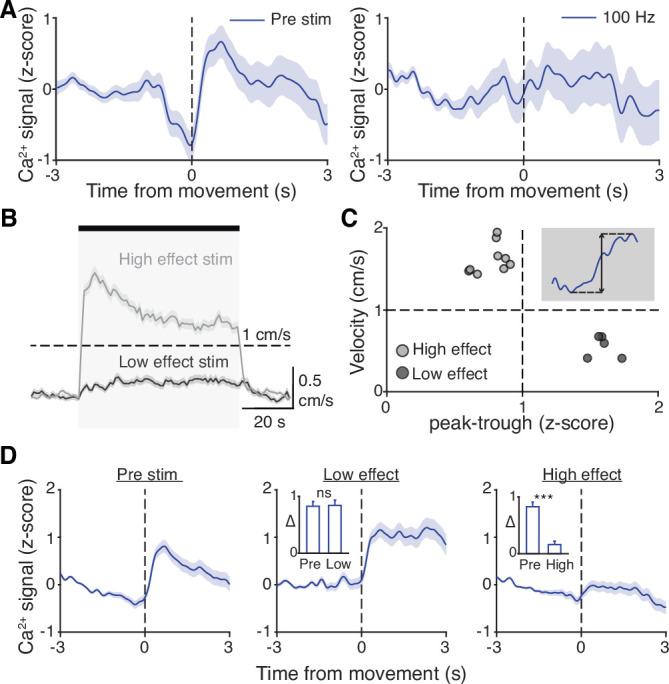
Figure 6. Subthalamic nucleus (STN) movement-related activity is disrupted by therapeutic STN deep brain stimulation (DBS).

(A) Average STN fiber photometry signal aligned to movement starts during pre-stim periods (left) and during 100 Hz STN DBS stimulation (right). (B) Average movement velocity over time during high effect stimulation (light gray, achieves average velocity >1 cm/s) and low effect stimulation (dark gray, achieves average velocity <1 cm/s). (C) Scatter plot comparing peak-trough distance in the average movement-aligned photometry trace (inset) to velocity during high effect (light gray) and low effect (dark gray) stimulation parameters. Each dot represents an average across all mice for each stimulation parameter (N=8 mice). (D) Average STN fiber photometry signal aligned to movement starts during pre-stim periods (left) and during low effect STN DBS stimulation (middle) and high effect STN DBS stimulation (right). Inset bar graphs show difference between average fiber signal in 1 s following movement start and 1 s preceding movement start (see Materials and methods for further details) during pre, low effect, or high effect stim. Statistical significance was determined using a Wilcoxon rank-sum test; ***p < 0.001 (see Supplementary file 1, table 1 for detailed statistics). Bar plots, photometry, and velocity traces show mean ± SEM.
