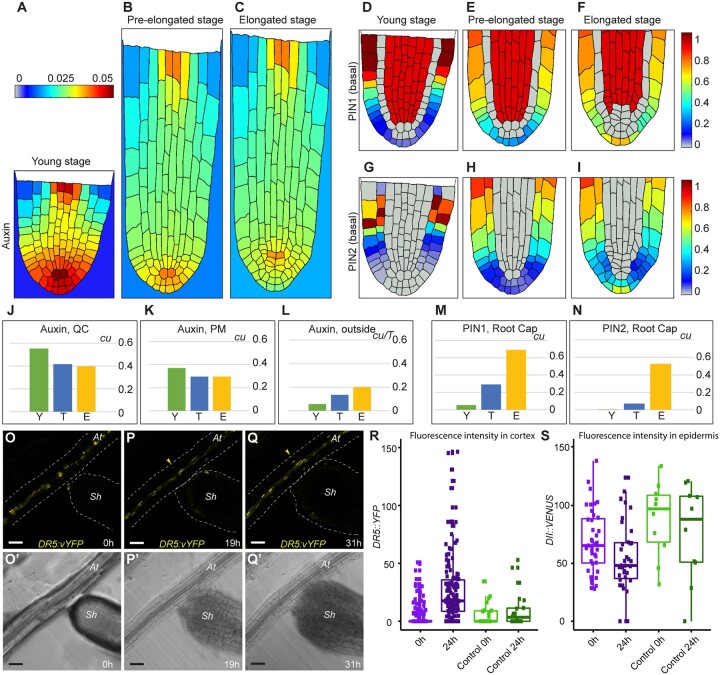
Figure 6.
Mathematical model depicting auxin distribution in S. hermonthica during root growth. (A–C), Quasi-steady state in auxin distribution inside and outside the Striga root at three consequent developmental layouts. (A, D, and G) Young stage (Y), (B, E, and H) pre-elongated stage (T), and (C, F, and I) elongated stage (E). D–F, PIN1 localization, G–I, PIN2 localization with basal polarity. PIN2 with apical polarity is depicted in Supplemental Figure S9. The color scale bars are concentration units (cu). J–N, Comparison of the variable values between the stages. Auxin levels in the QC (J); in the proximal meristem (PM) (K); excreted from S. hermonthica roots (L) during calculation time T. M, PIN1 levels in the root cap; N, the level of basally polarized PIN2 in the root cap. cu, concentration units. O–Q′, time-lapse images of germinating S. hermonthica in contact with Arabidopsis roots containing DR5::vYFP. S. hermonthica were used 24 h after germination, N = 10. O–Q, Fluorescence YFP channel. O′–Q′ PMT transmission channel. Arrowheads indicate ectopic DR5::vYFP expression in P, Q at A. thaliana (At). sh, S. hermonthica. Scale bars: 50 µm. R, the DR5 fluorescence values are significantly increased after 24 h when the Striga root differentiates in contact with Arabidopsis roots (two-tailed t test, P = 0.03794). The DR5 values are not significantly different when physical contact is not established with the Arabidopsis roots (two-tailed t test, P = 0.4947). S, the DII fluorescence values are significantly decreased after 24 h when the Striga root differentiates in contact with Arabidopsis roots (two-tailed t test, P <2.2e–16) the DII fluorescence are not significantly different when physical contact is not established (two-tailed t test, P = 0.3095). Control are striga plants that have not been in contact with Arabidopsis. Box limits indicate the 25th and 75th percentiles. Whiskers extend to the 5th and 95th percentiles. Points indicates the data.

