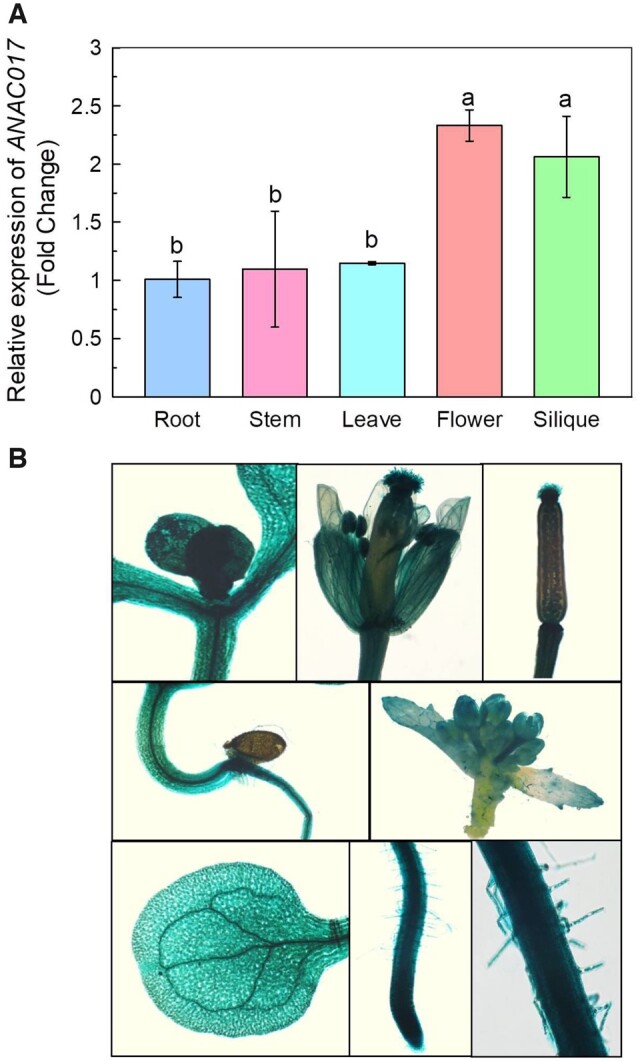
Figure 5.

Tissue specificity of ANAC017. A, Expression of ANAC017 in various tissues, as revealed by RT-qPCR. The data were normalized to the expression level of ANAC017 in the root, and TUBULIN was used as an internal control. Data are means ± sd (n = 4). Different letters above the bars indicate significant differences at P < 0.05 by one-way ANOVA analysis. B, Expression of ANAC017 in cotyledons, inflorescences, siliques, hypocotyls, leaf, and roots, as revealed by GUS staining. Scale bar = 400 μm.
