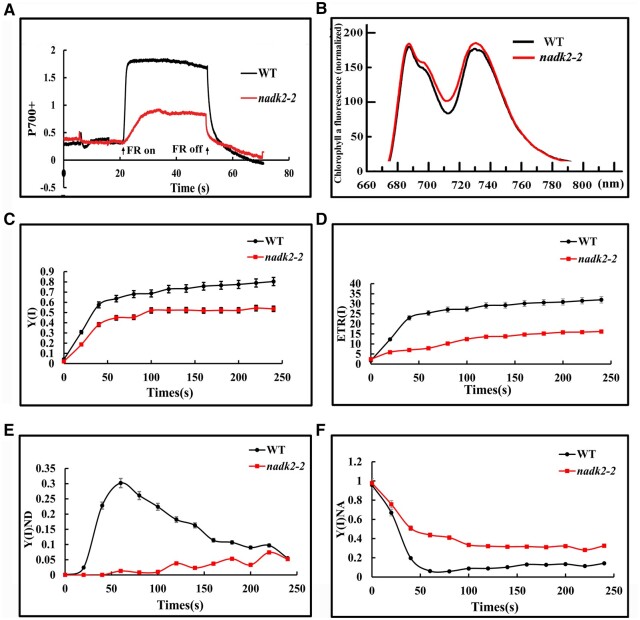
Figure 3.
Photosynthetic electron transfer of PSI in the WT and nadk2-2 mutant. A, Redox kinetics of P700 induced by far-red light at 720 nm. Absorbance at 820 nm indicates the P700 redox state. B, 77K fluorescence emission spectra of thylakoid membranes after excitation at 436 nm. The fluorescence emission signals were normalized to the PSII emission maximum at 685 nm. C, Quantum yield of PSI (ΦPSI). D, the ETR of PSI, ETR(I). E, Donor-side limitation of PSI,Φ (ND). F, Acceptor side limitation of PSI, Φ(NA). Results in (C–F) are presented as means ± sds (n = 3). Photosynthetic parameters of PSI were measured in the steady state of photosynthesis (820-μmol photons m−2 s−1) under 21 kPa O2 and 100 Pa CO2. PSI complementary quantum yields of energy conversion were measured based on the P700 redox kinetics.

