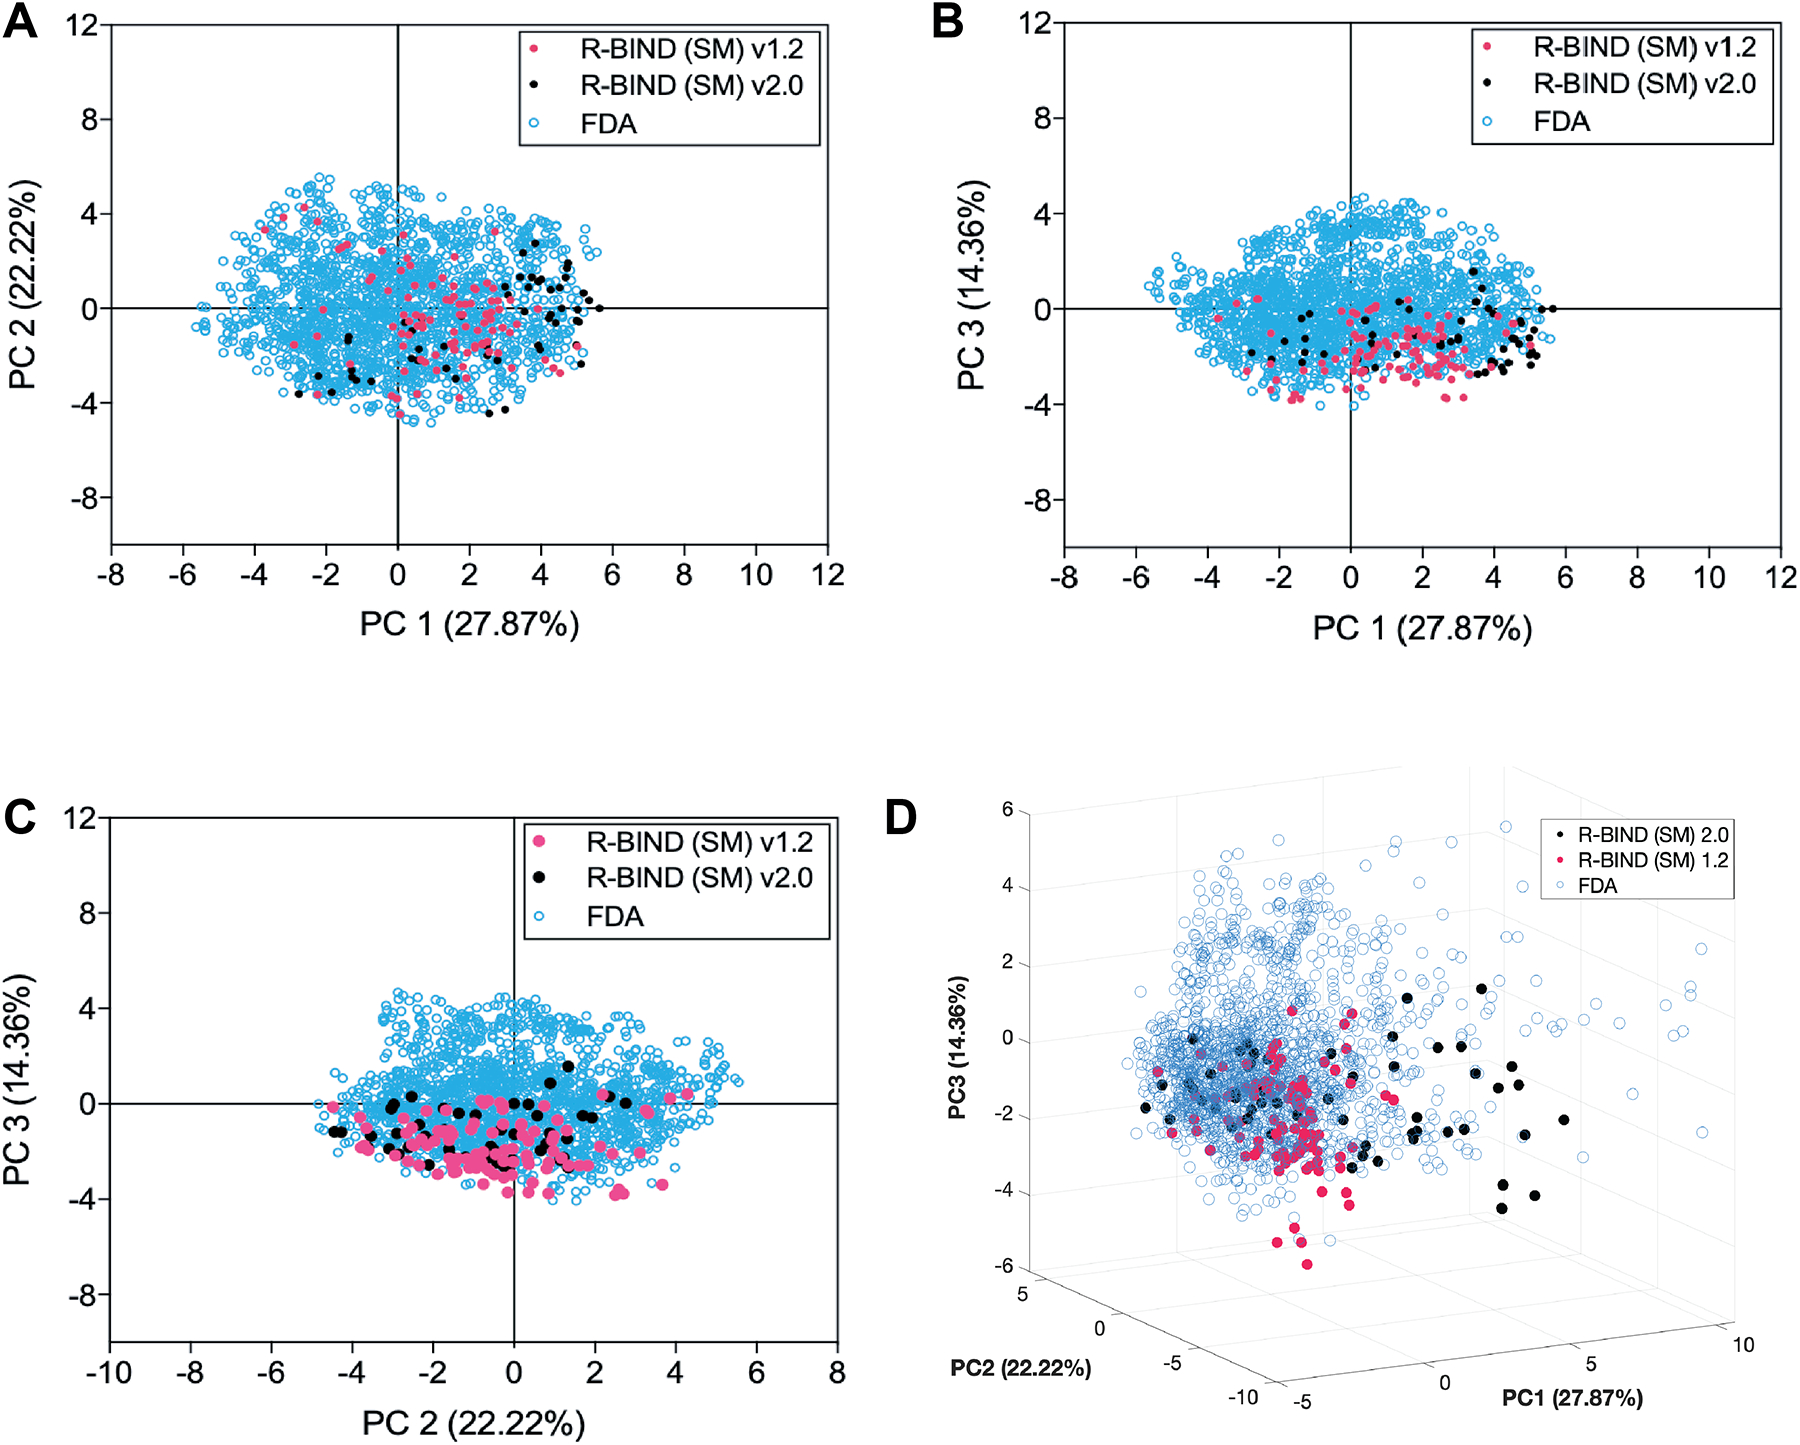
Figure 4.

Principal component analysis (PCA) plots describing the variance between libraries. (A) Two-dimensional plot of principal components 1 and 2. (B) Two-dimensional plot of principal components 1 and 3. (C) Two-dimensional plot of principal components 2 and 3. (D) Three-dimensional plot of principal components 1, 2, and 3. R-BIND (SM) 2.0 includes only the new ligands between 1.2 and 2.0. Contributions of each parameter are listed in Table S9, and the loading plots for the first three principal components are shown in Figure S1.
