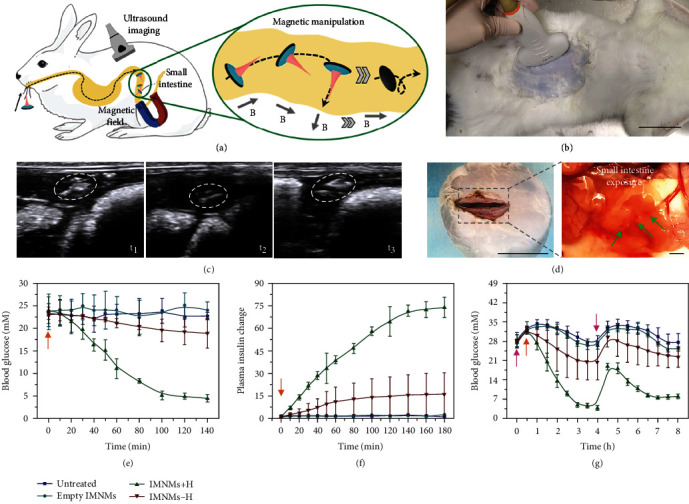
Figure 6.

In vivo animal experiments. (a) Schematic illustration of an IMNM being manipulated by magnetic fields inside the rabbit small intestine. (b) Image of ultrasound imaging on the rabbit. Scale bar: 6 cm. (c) Ultrasound images showing the position changes of IMNMs under changing magnetic fields. White circles indicate the IMNMs. (d) Images of the exposed rabbit small intestine showing the reserved needle layers. The needles are dyed red and pointed out by green arrows. Scale bars: 6 cm (left) and 2 mm (right). (e) Blood glucose levels at different time points of diabetic rabbits receiving no treatments, empty IMNMs without insulin, insulin-loaded IMNMs under the guidance of magnetic fields, and insulin-loaded IMNMs without magnetic fields. All treatments begin at 0 min. (f) Relative plasma insulin concentrations of diabetic rabbits in the above four groups. The initial plasma insulin concentration of each group is set as the unit. All treatments begin at 0 min. (g) Longer-time blood glucose level monitoring of diabetic rabbits in the above four groups. The pink arrows indicate glucose intake, and the orange arrows indicate IMNM application.
