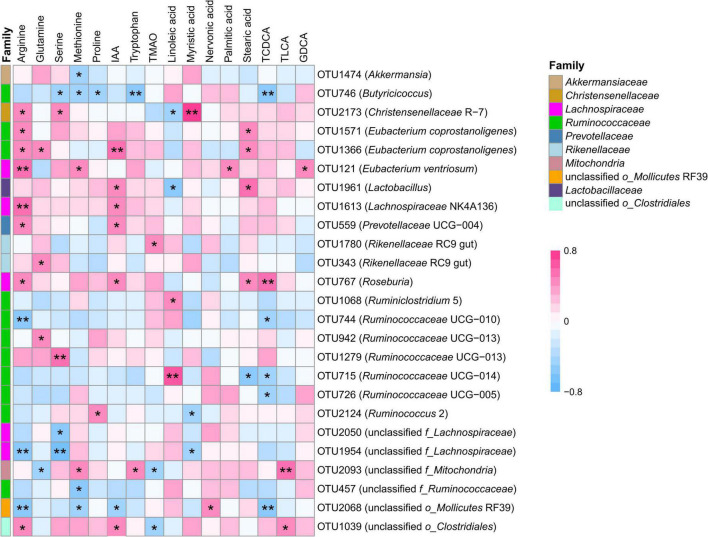
FIGURE 4.
Correlation between transplantation-sensitive operational taxonomic units (significantly differed OTUs) and serum metabolites following rumen fluid transplantation. Red represents a positive correlation, and blue represents a negative correlation. Only strong (Spearman’s |r| > 0.40) and significant (P < 0.05) correlations are presented in the figure. *P < 0.05, **P < 0.01.

